
Manual M10 · Austral Manual Series
Download PDF ↓Versión en español
Riesgo Fiscal Subnacional y Solvencia Municipal — Manual M10 de Austral
Version 1.0 · 25 September 2026
Austral Intelligence · David Duarte Arancibia, with Mika (Austral's analysis agent)
Platform module that runs the method: Subnational Fiscal Risk (/subnational_risk) — with the entity Risk Assessment (/subnational_risk/assess), the Batch Compare of up to a hundred entities ordered worst risk first (/subnational_risk/compare), the on‑screen manual, the threshold and preset library, and the risk scorecard report in workbook and PDF
Languages: English (this edition) and Spanish · HTML and PDF at austral‑intelligence.com/manuals
This manual explains how a ministry of finance — or an undersecretariat for regional development, or a development bank — answers for figures it does not decide: which of its subnational governments are a fiscal risk, which one is going to ask for money this year, and how much of what they owe ends up as an obligation of the central level. Its thesis is that a subnational government almost never goes under: it gets rescued, and that its fiscal risk therefore is not measured where almost every register looks — the stock of financial debt with the banking system — but where payment actually happens: accrued and unpaid expenditure, the transferred service funded out of discretionary transfers, the guarantee the central level extended, and the expectation of rescue that no contract writes down. It presents the diagnostic as a self‑contained ten‑step method, from the perimeter of the entity to the governance of the annual register, built on the International Monetary Fund's note on managing fiscal risks from subnational governments, on OECD working paper No. 46 on rising subnational fiscal risks, on subnational debt sustainability practice, and on the statutory regimes of five jurisdictions cited article by article — declaring, indicator by indicator, which cut-offs come from those sources and which are Austral's own calibration. It keeps two things apart that are routinely confused: the statutory gate, which produces a legal consequence, and the diagnostic indicator, which produces a reading; and it carries them through to the figure a ministry actually needs, the central‑level exposure by channel, which the method produces and no screen of the platform computes today. It walks the ten steps over a portfolio of four subnational governments with every figure shown, and includes a box on a local government in a jurisdiction that does not allow ordinary borrowing — the case in which a screen built on financial debt gives a clean bill of health to whoever cannot pay their suppliers. It shows how the method runs on the Austral platform, screen by screen and with what the module does not yet do declared as such; and it explains why this particular method breaks in a spreadsheet. It is written for subnational debt units, budget offices, supreme audit institutions and development banks.
Austral Intelligence (2026). Subnational Fiscal Risk and Municipal Solvency. Manual M10, Austral Manual Series, version 1.0, September 2026. https://austral-intelligence.com/manuals/subnational-fiscal-risk/
Every figure in the worked example (section 4) and in the screenshots (section 5) is generic: it belongs to the four subnational governments of the fictitious Republic of Lemuria, shipped as a demonstration pack in the platform, calibrated so that the method can be followed from start to finish. None of it comes from a client or from a real entity, and none of it should be used as a reference for the revenue, debt or contingent liabilities of any actual government. The figures are in millions of Lemuria's currency and correspond to the 2025 financial year; the country, the currency, the output of 60,000 and the central government revenue of 13,200 are declared assumptions typed in by the analyst, which is why every figure expressed as a percentage carries its base alongside. Where a named real municipality appears — in the box in section 4.7 — the figure is a published public datum, cited with its source and its year, and no figure of the exercise is attributed to it. The bands Low / Medium / High, their cut‑offs, their weights and the solvency knockout rule are an Austral calibration built on the literature cited, not a threshold of any international body, and the manual says so indicator by indicator. The methodologies cited are credited to their authors; the only product name in the manual is Austral.
This is the first English edition of Manual M10, translated from the Spanish edition closed on 25 September 2026. Every figure, table and citation is carried over unchanged, and the numerical agreement between the two editions is checked section by section; where the two differ, including after a future correction to either one, the Spanish edition is the reference. National instruments keep their official name in their own language with an English rendering of the title in parentheses; where the Spanish edition cited a Spanish rendering of a text that is official in another language, this edition cites the original and marks the English edition of that text as still to be verified (section 7). The Spanish edition does not yet carry a cover page of its own, so the version number and the citation slug on this page are provisional and are to be fixed together with it.
A ministry of finance answers for figures it does not decide. They are decided by a governor, a mayor, a municipal council. That government approves its own budget, levies its own taxes within the margin the law leaves it, hires its own staff and signs its own commitments; and when it cannot pay them, the one who pays is the central level. This manual answers three questions about that portfolio of governments: which of them are in difficulty, which one is going to ask for money this year, and how much of what they owe ends up as an obligation of the central level.
The manual's thesis fits in one sentence, and it is worth putting it before the method. A subnational government almost never goes under: it gets rescued. That is why its fiscal risk is not measured where almost every register looks — the stock of financial debt with the banking system — but where payment actually happens: the accrued and unpaid expenditure that carries over from one year to the next, the transferred service funded out of discretionary transfers, the guarantee the central level extended, and the expectation of rescue that no contract writes down. The method puts the two questions in that order: first what the entity owes, and then how much of that is, in fact, the central level's.
The size of what is at stake has been measured. The International Monetary Fund's methodological note on managing fiscal risks from subnational governments, citing the Fund's own study of public-debt shocks in eighty countries between 1990 and 2014, records thirteen episodes of macro-critical materialisation of central-government contingent liabilities arising from subnational governments, at an average cost of 3.7 % of output and a maximum of 12 % (§2.1). Its box 1 names them, and they come from every latitude and every institutional design: the 1993 federal refinancing of the debt of the Brazilian states, inside a package of around 7 % of output; the Hungarian absorption of the entire debt of its local governments between 2011 and 2014; the 2016 French programme to unwind local-government toxic loans. None of those episodes could be seen coming in a register of bank financial debt, and several appeared in no register at all.
And the other side of it: of the thirty-three countries that received a fiscal transparency evaluation from the Fund between 2013 and 2021, close to half had no direct control over subnational borrowing and had no information, or only limited information, on the finances of their subnational governments. Only five of the thirty-three combined quarterly publication of subnational statements with a borrowing limit. This is the manual's terrain: a large, recurrent risk, with a measured cost, and badly observed.
The question is: which of my subnational governments are a fiscal risk, which one first, and why? The product is a screening-level fiscal risk diagnostic, entity by entity and across the portfolio: every entity rated with the same methodology and the same thresholds as the others, every rating with the reason that produced it, and the portfolio ordered worst risk first.
From which follows, with the same clarity, what it does not answer.
What this diagnostic is not
- It is not a credit rating. It does not say whether the entity can place a bond, or at what price. A credit rating asks about the probability that the holder of an instrument will not be paid; this diagnostic asks about the probability that the national budget will have to pay. They are different questions and they can have opposite answers: an entity with a certain implicit rescue is good credit and bad fiscal risk, precisely because the rescue is what makes it good credit.
- It is not a full subnational debt sustainability analysis. It does not project the debt trajectory under macroeconomic scenarios, it does not model maturity structure or currency composition, and it does not compute a primary balance that stabilises the debt ratio. It is a screen that orders a portfolio in order to decide who that analysis is spent on.
- It is not an audit. It takes the figures the entity reports and uses them. It checks identities and internal coherence — that is Step 1 — but it does not verify that the reported figures correspond to facts. When the result is going to support an authorisation decision, the figures have to be audited beforehand, and the manual says so at every step where it matters.
- It is not — yet — a measurement of the fiscal cost to the central level. Step 7 teaches how central-level exposure is built channel by channel, and it is the reason a ministry of finance reads this manual; but no screen in the platform computes it today and the method produces it outside the tool. It is said here, in §3 Step 7 and in §5, with the same frankness in all three places.
- It is not a financial recovery plan, nor an opinion on whether a rescue is warranted. It points to the entity in difficulty, places it in the order of its portfolio and sizes how much of its obligation reaches the central level. What to do with it is a policy decision that this diagnostic informs and does not replace.
There is also a question the manual deliberately does not turn into a published figure. The Fund's note warns that assigning probabilities — or anything that looks like a probability — to individual subnational contingent liabilities in a public document is probably counterproductive, because it creates moral hazard through the expectation of rescue, and the OECD working paper says the same thing from the disclosure side (§2.1, §2.2). The manual takes that warning as a rule: the implicit rescue channel is named, argued from the diagnostic itself, and published without a figure, unless there is a basis for estimating it or the support programme has already been agreed, in which case it goes in explicitly. This is not opacity: it is the recognition that publishing a probability of rescue raises it.
The earlier manuals in this series deal with two other objects, and the difference is not one of sector or of size but of nature. A public-private partnership has a contract, and the contract says who pays what: the analytical work consists of reading the clauses and valuing them. A state-owned enterprise has a balance sheet and an ownership relationship: there is no clause saying how much the State will put in next year — an owner does not need to commit in writing — but there is an income statement that says whether it covers its costs out of its sales, and a classification test that decides which side of the State's balance sheet its debt sits on.
A subnational government has a budget, a bounded taxing power and an intergovernmental relationship. There is no contract and no ownership relationship: there is a sovereignty boundary. And the routes by which its risk reaches the national budget are written in no document. The Fund's note breaks them into four, which are the four that Step 7 turns into channels: the rescue of an entity whose debt became unsustainable; the calling of guarantees the central level granted, directly or through central institutions; central-level loans to subnational governments that have to be written down or restructured; and central transfers that have to be increased, earmarked or not — the note is explicit that earmarked transfers tied to priority programmes rise when the subnational government has no resources to fund its share. Put in this manual's vocabulary: the rescue that happens every year without being called a rescue.
That is why the method of a contract does not work here, and why this manual starts from the current account and not from the debt. The OECD working paper defines fiscal risk as the event whose realisation produces significant deviations of revenue or expenditure from budgeted amounts (§2.2). It is a budget definition, not a balance-sheet one, and it has a consequence the method follows all the way through: the first thing to look at in a subnational government is not its stock of debt but its current account, because that is where the deviation shows up. Debt is the accumulated result of that deviation, not its early signal.
There is a second difference, and it is the most uncomfortable of the three. In a public-private partnership the perimeter is given: the contract exists or it does not. In a state-owned enterprise the perimeter is an analytical decision about control and about classification. In a subnational government the perimeter is a decision and it also moves, because "the municipality" is almost never a single set of accounts: there is the central administration, there are transferred services — health, education — there are municipal corporations and foundations, utility companies and, in some jurisdictions, separate funds. Step 0 exists for that, and the most expensive mistake in this discipline is diagnosing the central administration of a municipality whose deficit lives entirely inside its health corporation.
The central level answers for an aggregate figure it does not decide. It is a structural asymmetry, not a management failure, and out of it come the two things this method has that a credit analysis does not.
The first is the same scale for every entity. A credit analyst assesses one issuer at a time and can afford a judgement tailored to that issuer. A central unit answering for forty municipalities needs all forty measured with the same formula, the same cut-offs and the same language, because its product is not an opinion on one but an order among all of them. Without a common scale there is no possible prioritisation, and without prioritisation the ministry attends to whoever shouts, who is rarely the one in the worst shape. (Austral, From Gatekeeper to Orchestrator.)
The second is the explicit declaration of what was not assessed. A credit analyst who does not have a datum does not issue the rating; the central unit does not have that way out, because the municipality exists and the risk is there with the datum or without it. Its only honest alternative is to rate with what there is and publish the coverage next to the rating. From which comes the method's cross-cutting rule: an indicator that cannot be computed is not computable, never a zero and never good news; and an entity with three indicators out of six is not comparable with one that has all six, however much the two of them say the same thing.
And a third consequence, which is about the division of responsibilities more than about method. The OECD paper assigns the national level two guiding principles: mitigate the subnational risks its own policies create, and make its support to entities hit by exogenous shocks minimise moral hazard; plus the duty to use the powers national legislation grants it to reduce the probability of a subnational financial crisis (§2.2). A diagnostic that only measures the entity and never looks at the transfer formula, at the devolution of functions without funding, or at the central level's own record of rescues is measuring half the problem.
This is not a project instrument: it is a calendar instrument.
It is run once a year, for the whole portfolio, with the closing of the entities' budgetary and financial statements, and it produces the year's register. Along with the manual on firm and contingent commitments and the one on state-owned enterprises, it is one of the few in the series that is run every year and not once per transaction.
And it is run on demand on an event, outside the calendar, when any of these four things happens: an entity applies for authorisation of a credit operation; an entity falls behind on its debt service or on payments to its suppliers; an entity asks for an extraordinary transfer; or an entity brings forward a public-private partnership project that commits its budget for twenty or thirty years. The first three are signals of materialisation, and the rule in Step 9 is explicit: a signal of materialisation does not wait for the annual cycle, it opens a case.
The fourth deserves a line of its own, because it is the seam between this manual and the firm's subnational line of work: the diagnostic is the first gate of a subnational public-private partnership programme, and it goes before the eligibility screening of the projects. The order is not one of convenience. An excellent project in a government that cannot sustain a multi-year commitment is a fiscal problem with a good technical appraisal, and the technical appraisal does not fix it.
The annual product feeds three calendars that are not its own: the budget, where next year's transfer is decided; the fiscal risk statement that accompanies or precedes the budget documents, which receives the subnational portfolio as one of its families; and the authorisation of credit operations, which is where the statutory gate produces its consequence. §3, Step 8, sets which figure goes to which and how they have to tie to each other.
Seven readers, seven different uses of the same register. It is worth listing them because the register has to serve all of them and none of them reads the same column.
Two warnings about the division of labour. The first: the perimeter is not decided by whoever operates the tool. Deciding that a municipal corporation enters its municipality's perimeter, or that a transferred service is consolidated, has accounting and statistical consequences that belong to government accounting; the fiscal analyst applies the rule, documents the result and takes it to whoever should formally decide it. The second: the result of a statutory gate is not an analyst's opinion. It is a legal situation, and whoever publishes it takes responsibility for having computed it on the denominator the law defines. §3 separates the two things into two distinct steps for exactly that reason.
For each entity and for the portfolio, the method produces four figures and a list. The five go together: published on its own, any of the first four is misread.
Figures 1, 2, 3 and 4 measure different things in different units, and the manual never adds them up or mixes them. The first is an ordinal band, the second a legal situation, the third a relative position and the fourth an amount. Adding two of them produces a number that means nothing and that, invariably, someone quotes.
It is the commonest error of a subnational register, and it deserves its own heading because it is the thesis that organises the whole manual.
The wrong reasoning is reasonable: the entity binds itself in writing to its financial creditors, therefore its obligation is the stock of bank credit and bonds. It fails on two sides at once.
It fails from below, because in a good part of the world's jurisdictions the local government may not borrow, or may borrow very little, and its real obligation is somewhere else. The extreme case is verified and it is the first market of this line of work. In Chile, municipal assets are listed exhaustively in the organic law of municipalities — property, the regional government's contribution, income from the common municipal fund, fees for services, permits and concessions, taxes of clear local identification, fines and interest — and there is no paragraph on borrowings, on debt or on credit operations; the word "credit" does not appear once in the text of the law. Municipal corporations and foundations are expressly prohibited from contracting borrowings. The regime of the regional governments repeats the pattern, and adds that they may not guarantee or secure the commitments of the entities they fund (§2.6). A screen that orders Chilean municipalities by their financial debt returns a flat portfolio, and the indicator that carries most weight in most sets of ratios stops measuring anything.
What that municipality does carry is its floating debt — the difference, at year-end, between accrued expenditure and the payments corresponding to that expenditure; that is, accrued expenditure left unpaid — plus the deficits of the transferred health and education services and its court-ordered obligations. None of those three is financial debt and none of them appears in a register of debt with the banking system.
It fails from above, because the stock of financial debt is not what the central level is going to pay either. What it pays is what the entity cannot service out of its revenues, and that depends on its current account and not on its balance sheet. Two entities with the same debt-to-revenue ratio and opposite current balances are two different risks, and the one with the current deficit is the one that will come asking. That is why the solvency knockout in this method sits in debt service and in the operating balance, and not in the stock; and why there is one jurisdiction — Peru's — that has already turned the current balance into a legal rule, requiring that saving on current account not be negative (§2.4).
The practical consequence is uncomfortable and has to be written down: a screen that only looks at financial debt gives a clean bill of health to whoever cannot pay their suppliers. The correction is the structure of the method, and that is why its steps go in the order they go: the perimeter before measuring, the accounts and their quality — with the current account separated from the capital account and accrual separated from cash, because the difference between the two is a liability — before the indicators, the legal gate separated from the indicator, and the bridge to the central level at the end, which is the only thing that answers "how much?".
This sequence has backing in the firm's published work, one level of government up. The Anchor and the Perimeter derives the boundary between what the sovereign owes and what it does not as a result and not as an assumption, applying the classification test entity by entity; The Recognition Rule measures the distance between what the rules oblige one to recognise and the tail the sovereign actually carries; and The Useful Silence explains why that liability tends to go unvalued and who benefits from it staying that way. This manual takes from there a requirement and not an opinion: the perimeter is declared before measuring and published with the result, because nothing distinguishes "there is no risk" from "we did not look".
Three things, in the order of the series.
A self-contained method. §3 develops ten steps, from the perimeter to monitoring, with what goes in, what comes out and what the decision rule is at each one, and closes with the reviewer's checklist. It is written to be executed with any tool: a spreadsheet and a folder of evidence are enough, and that is the condition for §6 to be able to show afterwards where that spreadsheet breaks. The skeleton is the OECD risk management cycle — identify, analyse, mitigate, transfer or share, and responsibly accommodate the residual — unfolded into ten operational steps. §2 credits each rule to its source with its section or its article, and says where the sources do not agree and what position the manual takes.
A reproducible example. §4 walks the ten steps over a portfolio of four entities spread along the risk spectrum — three that cover the scale end to end and a fourth with a mixed profile, which is the only one where the consolidation rule can be seen working — with opening figures, the result at each step and the reading, and with the contrast that turns the exercise into a lesson and not a demonstration: the same entity, the same figures, a different rule book, a different answer. Never a client's data. And a box on the Chilean case — a municipality in a jurisdiction that does not allow borrowing — with the real municipalities named and their dependence on the central transfer cited from a public source.
And the largest limit, declared here and not in the fine print: this edition works with a single period per entity. The method in §3 asks for two to five financial years and the trend reading needed to judge solvency; the tool in §5 takes one year, and the example in §4 is therefore a snapshot. Every figure that rests on that snapshot says so on the spot. The multi-year series — change and direction by indicator, trend band, and the Step 9 reconciliation between two runs by its four causes — is the work of the second edition.
The tool that runs it, and that the client keeps. §5 shows the module screen by screen, with what it asks for, what it returns, what it exports and what it still does not do, declared as such. §6 is honest about the spreadsheet argument: most territorial finance units work in a spreadsheet and do it well for one entity; what the manual takes issue with is not the spreadsheet but what happens to it when it stops being an instrument of analysis and becomes the annual register of forty entities, with two legal regimes, thresholds by country and a reporting chain behind it. §7 gathers the references with their verification status.
And what the manual does not deliver, said without decoration. Austral has no published paper on subnational fiscal risk. The research idea the firm had in this territory was abandoned for a null result, and the record of that decision left it in writing that there is no clean documented case of central-level absorption of a state or provincial public-private partnership. This manual is the firm's first text on the terrain, and the methodological note that decision left standing.
Saying so is better than implying support that does not exist, and it is also the argument. A null result here is not an accident: it is the same finding the Fund's note makes when it finds that half the countries evaluated have no information on their subnational finances, and the one the OECD paper makes when it explains that its own analysis is mostly qualitative because no national or comparative databases exist on the incidence and management of subnational fiscal risks, and calls for a start to be made on building them. The manual's two main sources declare the same hole. On terrain like that, a method that declares what it did not measure is worth more than one that promises coverage — and that is, exactly, the fifth of the five figures.
Anyone who only needs to know whether a subnational register arriving for signature is well made can go straight to the reviewer's checklist at the close of §3. Anyone who wants the logic on one page, to the summary at 3.10.
Every rule of the method in §3 comes from a source that can be opened and argued with. This section says which one, with its section or its paragraph. But the honesty it demands is different from that of the earlier manuals in the series, and it is better said on the first page than left for the reader to discover on the fourth.
For the state-owned enterprise there is a canonical tool from an international body, with its user guide published, and the corresponding manual reimplements it step by step. For the subnational government no such instrument exists. What there is is something else, and it is of four kinds. A supervisory doctrine: the International Monetary Fund's methodological note on how to manage the fiscal risks that come from subnational governments, which sets the chain diagnostic → supervision → central-level exposure and proposes five analytical dimensions with an annex of suggested ratios. A risk management framework: OECD working paper No. 46 on managing rising subnational fiscal risks, which supplies the operational definition of fiscal risk, the management cycle and a taxonomy of six sources. A statutory practice: half a dozen national legal regimes that set subnational borrowing ceilings, each measuring a different thing on a different denominator, and none comparable with its neighbour without translation. And a municipal creditworthiness initiative of a multilateral bank that the firm's own offering had been declaring as its basis and that, read closely, is not a set of financial ratios but a qualitative self-assessment questionnaire (§2.5).
From which comes the statement that organises this section and that the manual does not soften: the set of six ratios, their two cut-offs each, their weights and their knockout rule are an Austral calibration built on that literature. They belong to no international body. They are informed by the Fund's five dimensions, by the statutory practice of the countries and by the way rating agencies build their subnational credit profile; but the particular cut-off that separates a Medium from a High on each indicator is chosen by this firm, and whoever wants to argue about it argues with this firm and not with the Fund. §2.3 says so indicator by indicator.
A reading warning, at the three points where the sources do not agree. (i) The Fund note's own annex of suggested ratios measures debt burden against free own revenue; the statutory ceilings of almost every country measure it against current revenue or total revenue. This manual's method follows the second convention and not the first, and §2.3 explains why and at what cost. (ii) The legal gate and the diagnostic indicator resemble each other in the arithmetic and in nothing else: one produces a legal consequence, the other a reading. The manual always keeps them apart, and §2.4 is the section where that separation is grounded. (iii) The multilateral bank's city creditworthiness initiative and this module's engine answer different questions — practices and enabling environment the first, financial statements the second — and crediting the one as the source of the other would be a false citation. §2.5 settles it and says which part of that initiative remains a product roadmap and not a foundation of the method.
A terminology warning. This manual uses "subnational government" (SNG) as its general term — it covers states, provinces, regions, departments and municipalities — which is exactly the usage the Fund's note declares in its first footnote. It reserves "municipality" for the specifically municipal argument and "entidad territorial" only when citing Colombian law, where it is the legal term. It keeps "ahorro operacional" untranslated when citing Colombian law, because there it is a term with its own statutory definition, and uses "operating balance" or "current balance" outside that citation. It calls "accrued and unpaid obligations" what Chilean law calls "deuda flotante", and uses the Chilean term when citing it. The bands Low / Medium / High are the product's own taxonomy in this language, and the manual neither paraphrases them nor converts them into a three-colour traffic light: the reader is given the same word the screen shows. The green / amber / red traffic light is a different matter and is named as such, with the precision §2.4 makes: it is the name by which practice and the literature know the Colombian regime, not the vocabulary of the text of the law.
And one point about scope. This manual uses no client figures and no budget execution data from any national budget body. When it cites a country's practice, it cites structure, rule and frequency of publication, never magnitudes of its entities. The final correspondence table (§2.8) links each step of §3 to the source that backs it and to the screen in §5 that runs it, and flags the steps that have no screen today.
It is the source that places this diagnostic inside a function of the State and not inside a credit analysis, and it is the only one in the literature that runs the whole length of the chain a ministry of finance cares about: identify entities in difficulty → estimate central-level exposure → provision → disclose. The note is from 2022, was prepared by Sandeep Saxena for the Fund's Fiscal Affairs Department and was published in the department's How To Notes series under number 22/03; its twenty-three pages are organised in five sections and two annexes. This manual read it in full and cites it by section and by page.
Its thesis, and why it opens the manual. The note starts from the position that unsustainable subnational finances are a continuous drain on central resources and that the central government needs institutional mechanisms to monitor the health of subnational finances systematically and to be able to manage those risks ahead of time. And on its first page it breaks out the four ways subnational risk reaches the national budget, which are the four that Step 7 of §3 turns into channels: the rescue of a subnational government whose debt becomes unsustainable — through excessive deficits, off-budget borrowing, guarantees to its own enterprises or unsustainable debt of those enterprises; the calling of credit guarantees the central government granted, directly or through central institutions; central government loans to subnational governments that have to be written down or restructured, or whose value erodes; and central transfers that have to be increased, earmarked or not. The note is explicit that earmarked transfers tied to priority programmes rise when the subnational government has no resources to fund its share. It is, put in this manual's vocabulary, the rescue that happens every year without being called a rescue.
And it gives the magnitude. Citing the Fund's own study of the sources of public-debt shocks in eighty countries between 1990 and 2014, the note records thirteen episodes of macro-critical materialisation of central-government contingent liabilities arising from subnational governments, at an average cost of 3.7 % of output and a maximum of 12 %. Its box 1 puts names to them: the 1993 federal refinancing of Brazilian subnational debt, inside a rescue package of around 7 % of output; the federal assumption of Argentine provincial debt between 2001 and 2004; the Mexican extraordinary transfers after the 1995-98 crisis, estimated at 0.5 % of output; the deterioration of Indian state finances in the early 2000s; the Hungarian absorption of the entire debt of local governments between 2011 and 2014; the 2016 French programme to unwind local governments' so-called toxic loans; the Austrian emergency loan to the state of Carinthia; and US state interventions in municipalities in difficulty. None of those episodes could be seen coming in a register of bank financial debt.
The finding that justifies this manual's existence. The note measures how much this risk is looked at, and the result is uncomfortable: of the thirty-three countries that received a fiscal transparency evaluation from the Fund between 2013 and 2021, close to half had no direct control over subnational borrowing and had no information, or only limited information, on subnational finances. Only five of the thirty-three combined quarterly publication of subnational statements with a borrowing limit. §1 of the manual says this is terrain where the data are dark; the note quantifies it.
The five analytical dimensions, which are the skeleton of §3 Step 3. The note proposes building the quantitative risk assessment framework around five analytical dimensions, and defines them one by one: fiscal capacity and flexibility — the capacity to sustain its fiscal position and the flexibility to adjust future revenue and expenditure, by raising taxes, broadening the base or containing spending; operating performance — the capacity to generate revenue sufficient to cover operating expenditure; liquidity management — the capacity to meet its short-term obligations efficiently; debt capacity — the level of indebtedness and the capacity to take on additional debt; and asset management. The module in §5 covers the first four and does not cover the fifth, and §2.3 declares it.
The annex of ratios, and the point where this manual parts from it. Annex 1 of the note proposes a set of ratios for each dimension: revenue and expenditure per capita; own revenue over total revenue, which the note describes exactly as the measure of the degree of dependence on external sources of financing; discretionary expenditure over total expenditure, defining the discretionary part as non-essential spending — the total less salaries, interest, mandatory services and capital projects under way; operating balance over revenue; free cash and liquid assets over current liabilities; short-term debt over total debt, as a measure of refinancing risk; debt over free own revenue, with debt over subnational output as an alternative where reliable estimates exist; operating balance before interest and depreciation over debt service, with the caveat that it is advisable to use "maximum future debt service" where the debt has bunched payments, grace periods or introductory rates that reset; and three asset management ratios. And it closes with a design rule this manual adopts and repeats: it is advisable to keep the number of indicators manageable and to concentrate on those that identify the entity's key areas of risk.
Three of those ratios the module does not compute today and the manual does not promise: the asset management ones, discretionary expenditure and the per capita figures — which require a population datum the module does not have. And one of them the module computes the other way round from the way the note suggests: the note measures debt burden against free own revenue; the engine measures it against total revenue. It is the most consequential divergence in this section, it is declared here, and §2.3 argues it rather than glossing over it.
What the note says about quantifying central-level exposure, which is Step 7. Here the note is more practical than the literature usually is, and it is worth quoting closely because it authorises a shortcut the manual uses. It says that quantifying the risk typically involves an estimate of probability-weighted exposure, but that in most cases it is enough to record the maximum exposure the central government has to its subnational governments. And it specifies what has to be measured to record it: (1) the debt and other financial liabilities of the subnational governments that the central government might be forced to assume, and (2) any other unanticipated financial outflow from the central to the subnational level if an entity's financial position deteriorates significantly. In accounting terms — the note says so itself — those risks are contingent liabilities, explicit or implicit, of the central government. And it adds the presentation rule that Step 7 inherits: it is enough to measure total exposure under each risk category, with a split between short- and long-term obligations that makes it possible to separate the immediate potential outflows, which are the ones that deserve budgetary consideration.
From which comes this manual's position on Step 7: no probability model is needed to start; what is needed is to publish the amounts that already exist, channel by channel and without adding them up. Which is what the module does not do at all today (§5.7).
And the rule of silence, which this manual turns into a norm. The note warns that, in making the budgetary provisions, care must be taken not to identify explicitly the subnational governments that are likely to claim central resources, and that assigning probabilities — or anything that looks like a probability — to individual contingent liabilities in a published document is probably counterproductive, because it creates moral hazard through the expectation of rescue. The provision can be made under an aggregate contingency line. The exception the note itself writes: rescue programmes already agreed or approved do go in explicitly, as a separate line, for transparency and monitoring. It is the reason Step 7 of this manual names and argues the implicit rescue and publishes it without a figure, unless there is a basis for estimating it.
What the note says about disclosure. Its section III.D asks that subnational risk be disclosed routinely, ideally in a fiscal risk statement accompanying or preceding the annual budget documents, and lists four contents: the aggregate fiscal performance of the subnational sector with its key indicators; an entity-level financial analysis focused on identifying those in difficulty or close to it — with the rest aggregated, and examining revenue adequacy, liquidity, leverage and solvency for each; the relations with the central government, in terms of transfers, debt owed, arrears and outstanding guarantees; and the main risks identified with their mitigation measures and a discussion of the supervisory regime. It is, point for point, what the subnational row of the consolidated register of M9 ought to carry.
Its box 7 adds the yardstick by which this is measured: the Fund's fiscal transparency code grades the indicator on fiscal coordination with subnational governments at three levels — basic, annual publication of reports on the financial condition and performance of subnational governments; good, that plus limits on subnational liabilities or borrowing; advanced, quarterly publication of reports on local governments' performance and financial condition. §2.6 uses that scale to read the table of country practice, and it is the reason that table asks about frequency and not only about existence.
The note's four conclusions, which §1 and §3 of this manual take up: central supervision of subnational finances, with a dedicated unit in the ministry of finance responsible for risk analysis, for feeding the fiscal risk statement and for contributing to the management strategy; a regulatory framework for subnational financial management; a general-government rather than a budgetary-central-government approach; and public financial management capacity at the subnational level itself. And a warning this manual repeats in Step 1: the analysis will be only as good and as reliable as the data that feed it, and obtaining those data is usually the main problem.
Working paper No. 46 in the OECD's fiscal federalism series, by Luiz de Mello and Teresa Ter-Minassian, published in June 2024 and discussed at the April meeting of that year of the OECD Network on Fiscal Relations across Levels of Government, is the other leg of this section. It was read in full. It contributes four things, and all four enter §3.
The operational definition, and why §3 starts from the current account. The paper defines fiscal risk, in its first paragraph, as events whose realisation leads to significant deviations of revenue and/or expenditure from budgeted amounts. It is a budget definition, not a balance-sheet one, and it has a consequence the manual follows all the way through: what has to be looked at first in a subnational government is not its stock of debt but its current account, because that is where the deviation shows up. Debt is the accumulated result of that deviation, not its early signal.
The management cycle, which is the skeleton of §3. The paper's key messages state it thus: a comprehensive subnational risk management framework includes steps to identify, analyse, mitigate and, where appropriate, transfer risks, as well as responsibly accommodate the materialisation of residual ones. Paragraph 31 unfolds it with more precision — identification, analysis and where possible quantification, reporting and disclosure; choice of prevention and mitigation options and, where appropriate, sharing or transfer; and financial accommodation and operational management of the materialisation of untransferred risks — and attaches to it the condition Step 9 of this manual inherits: the framework requires adequate governance arrangements, because the necessary information is usually dispersed across units that do not share it in time, and the power to take on certain risks — guarantees, first of all — is usually fragmented within the organisation itself.
The taxonomy of six sources, which is the one §1.2 uses to say what a subnational government's risk is made of: macroeconomic risks (2.1); climate change and natural disasters (2.2); public health (2.3); contingent liabilities (2.4); weaknesses in budget institutions and processes (2.5); and challenges of digitalisation (2.6). Of those six, the module in §5 measures one well — contingent liabilities, and in aggregate form — and half of another, budget-institution weaknesses, indirectly through data quality. The manual says so here and repeats it in §5.7. The other four enter the method as the declared perimeter of Step 0 and as the list of what was not assessed in Step 3, not as an indicator.
Correlation, which is the rule of Step 6. Paragraph 30 is explicit: many of the risks in those six families are positively correlated. Recessions, inflation episodes with their rate rises and currency depreciations simultaneously raise the probability that explicit and implicit contingent liabilities will materialise; weaknesses in budget institutions amplify the fiscal impact of macroeconomic risks; and climate change raises the risk of disasters and of endemic disease at the same time. The paper closes the paragraph by saying that those correlations must be adequately incorporated into assessment and management. This manual's method applies it to the portfolio: adding up the worst cases of N entities in the same country assumes perfect correlation and must be labelled an upper bound, not a forecast (Austral, Stress-Testing PPP Portfolios).
And the division of responsibilities between levels, which is the boundary §1.3 calls "responsibility without control". Section 3 of the paper assigns to the subnational government identification, analysis, reporting and disclosure (3.1), mitigation (3.2) and management of residual risk (3.3). Section 4 assigns to the national government two guiding principles, written in its paragraph 71: mitigate the subnational risks its own policies create, and make its support to subnational governments hit by exogenous shocks minimise moral hazard; and, second, use the powers national legislation — including the Constitution — grants it to minimise the risk of subnational financial crises. The preceding paragraph explains why the national level cannot stand aside: poor subnational management of asymmetric shocks has spillover effects on other entities, and a subnational financial crisis creates significant fiscal risk for the national level.
Two pieces of the paper that §3 uses directly. The first is the treatment of guarantees (paragraphs 43 and 44 and box 2): it requires keeping an inventory that is complete and frequently updated of the guarantees granted, with their nature, their face value, their maturity and the evolution of disbursements and amortisations of the guaranteed loans; and it splits the analysis into two steps — assess the probability of realisation of each guarantee, or at least of each one whose face value exceeds a chosen threshold, and then estimate the fiscal cost of its being called. Box 2 sorts the probability estimation methods into three families — credit rating, statistical models and financial models — and observes that, given the capacity constraints of many subnational governments, the credit rating method is usually preferable, though even that one requires understanding the factors that determine the realisation of each guarantee and, in particular, the beneficiary's financial condition: debt-to-equity, debt-service-to-revenue and liquidity ratios give useful signals. This manual records the stock and does not value it; valuation is the business of M7, and this is the source that draws that boundary.
The second is the disclosure rule with its exception, paragraphs 52 and 53. The paper asks that subnational fiscal responsibility laws or organic budget laws require the preparation and inclusion in annual budgets of a fiscal risk annex with the risks identified, an assessment of their probability and expected cost, the mitigation measures and an account of the risks that materialised during the year. And it immediately sets the limit: the largest and most developed subnational governments may need to avoid publishing quantitative estimates of the probability and cost of individual risks — the paper expressly names the realisation of implicit guarantees — where their disclosure would create significant moral hazard, and it suggests that external scrutiny, including by an independent fiscal institution, helps to balance transparency against moral hazard. It is the same rule the Fund's note writes from the budget side, and the two together are the basis of the position in §1.6 and Step 7: the implicit channel is named, argued and published without a figure.
This is the section the product does not write and the manual does. It goes indicator by indicator, saying which part comes from the literature and which part is Austral's choice. The reading rule is simple: the source backs the ratio; the cut-off is chosen by the firm.
| # | Indicator | How the engine computes it | Direction | Where the ratio comes from | What is Austral calibration |
|---|---|---|---|---|---|
| 1 | Revenue autonomy | own revenue / total revenue | lower is worse | Annex 1 of the Fund's note, fiscal capacity and flexibility dimension; the note defines it as the measure of dependence on external sources of financing | The two cut-offs and the weight |
| 2 | Debt burden | debt / total revenue | higher is worse | Comparative statutory practice (§2.4 and the table in §2.6): Brazil, Peru, Colombia, and the threshold table of the Fund's note, which collects those of ten countries — eight of them with a debt-to-revenue ceiling | The two cut-offs, the weight, and the denominator: the Fund's note suggests free own revenue (see below) |
| 3 | Debt service | (principal + interest) / total revenue | higher is worse | The same statutory practice; the Fund's debt capacity dimension | The two cut-offs, the weight, and its status as a knockout |
| 4 | Operating balance | (current revenue − current expenditure) / current revenue | lower is worse | Annex 1 of the Fund's note, operating performance dimension, "operating balance over revenue"; and the Peruvian fiscal rule, which makes this magnitude a legal gate (§2.4) | The two cut-offs, the weight, and its status as a knockout |
| 5 | Liquidity | liquid assets / short-term obligations | lower is worse | Annex 1 of the Fund's note, liquidity dimension, "free cash and liquid assets over current liabilities" | The two cut-offs and the weight |
| 6 | Contingent liabilities | contingent liabilities / total revenue | higher is worse | Section 2.4 of the OECD paper (contingent liabilities as one of the six families) and the face-value recording practice of its paragraph 43 | The two cut-offs, the weight, and the decision to express them as a ratio over revenue |
The severity weights — which the engine publishes in its browsable library, and which is a merit of the product because it makes exactly this auditable — sort the six into three classes: solvency (debt service and operating balance), leverage and liquidity (debt burden and liquidity), and informational (autonomy and contingent liabilities). That ordering belongs to nobody else. It is informed by how others do it — the Fund's note reproduces, in its footnote 9, the structure with which a rating agency builds the credit profile of a subnational government outside the United States: seven weighted factors — economy, financial management, budgetary flexibility, budgetary performance, liquidity, debt burden and contingent liabilities — combined with the country's institutional framework and then adjusted for overriding factors and sovereign considerations; and it also records the study by the treasury corporation of the Australian state of New South Wales which in 2013 rated the financial sustainability of 152 local governments with ten indicators in four categories, with explicit benchmarks and weights and seven result bands, from "very strong" to "in distress". But the particular weighting of this method is Austral's, and §4.4 puts it through a sensitivity test so the reader can see how much of the rating is data and how much is a choice of band.
The denominator decision, which is the one that has to be defended. The engine measures debt and debt service against total revenue, not against own revenue. The reasons are three and it is worth setting them out in full, because the principal source suggests the opposite.
The first is double counting: measuring debt against own revenue penalises the same weakness twice, because transfer dependence is already measured by the first indicator. An entity with 25 % own revenue would come out badly on autonomy and four times worse on debt burden than an identical one with 100 % own revenue, even though the two of them receive the same cash flow with which to service the same debt.
The second is legal reality: in an intergovernmental system transfers are not a favour but an entitlement established by law or by constitutional formula, and in many jurisdictions they are the dominant and stable source of the local budget. Treating them as though they did not exist turns every municipality in a unitary country into a hopeless case.
The third is comparability with the legal regime: the statutory ceilings collected in §2.4 are measured on current revenue, on average current revenue or on receita corrente líquida — all of them aggregates that include transfers — and none on own revenue. A screen using a denominator no law uses would produce a portfolio order that cannot be checked against any gate.
And the declared cost of that decision. Annex 1 of the Fund's note suggests, for the debt capacity dimension, the ratio debt over free own revenue, with debt over subnational output as an alternative. This method does not follow it, and what is lost has to be said: an entity whose transfers can be cut by a decision of the level above has less real capacity to service its debt than an entity with the same ratio on an own-revenue base, and this indicator does not see it. The mitigation is one of method, not of formula: the autonomy indicator is read together with the debt burden one, never separately, and §3 Step 3 writes it down as a reading rule. Anyone who needs the ratio from the Fund's annex computes it separately, from the same inputs as Step 1; the manual says how. Note, and §5.5 returns to this, that the borrowing capacity calculator in the workspace's own subnational mode uses the opposite convention — own revenue — which leaves the product giving two opposite answers to the same question. The manual takes the engine's convention, for the three reasons above, and declares the divergence instead of hiding it.
Two cross-cutting rules that are not cut-offs and are method.
The first: an indicator that cannot be computed is N/A and carries a flag of incomplete assessment, never a zero and never a Low. A missing datum scored as a zero unfairly lowers a rating; a missing datum ignored raises it, and that is the worse error, because it rewards the entity that reports least. The overall rating is published with its coverage — how many of the six indicators could be computed — and an entity with three indicators is not comparable with one that has six, however much the two of them say "Medium".
The second: the operating balance has two versions and they are not the same figure. The current balance proper — current revenue less current expenditure, over current revenue — is the one the agencies publish and the one the operating performance dimension of the Fund's note describes. When the entity does not supply the current-account split, what can be computed is a gross operating margin over total revenue, which is a different measure. The manual requires a declaration of which of the two was published, and §4.2 shows the difference with numbers.
The thresholds that were attributed to a rating agency, and the own calibration that replaced them. The module used to publish, among its cited sets, a set of cut-offs attributed to the local government methodology of a United States rating agency, marked in the product as adapted. This manual maintained from the start that it named the source and did not reproduce its figures, for a twofold reason worth keeping in writing even though the set is no longer there: an advisory firm's manual that republishes a commercial agency's cut-offs under its own name moves onto licensing and trademark ground; and, more fundamentally, an agency's medians are not a risk threshold but a description of the universe that agency rates, so that using them as a cut-off imports a reference population that need not resemble the reader's portfolio.
The product recommendation that accompanied that argument — replace it with an Austral calibration of its own for high-income local governments, labelled as such — has been delivered. The library today publishes, in that place, a set that carries no country name and no agency name, whose source field contains this firm's reasoning instead of an external citation — developed access to the municipal bond market, long fixed-rate debt, formal supervision or intervention regimes that bound the tail, and broad and predictable own tax bases, which together sustain a structurally higher debt burden and debt service than the default screen — and that carries a confidence mark of its own, distinct from "direct", "adapted" and "unverified". Anyone needing to compare against a particular agency's methodology should go to that agency's published source: this set does not replace it, and says so.
And the manual does not soften what remains a defect: that calibration loosens the cut-off of the debt-service knockout indicator (§4.5, §5.2), just as the Colombian and the Brazilian municipal sets do. Having the reasoning declared is an improvement in honesty, not a licence to move a knockout.
A diagnostic indicator produces a reading; a statutory gate produces a legal consequence. Confusing them is the error §6.7 denounces and the one this manual avoids on every page: calling "alert" what the law calls "prohibition" turns a question of law into an analyst's opinion, and on the day the comptroller asks why an operation was authorised, the opinion is of no use.
The following table collects the five regimes the module implements as cited threshold sets, plus the Chilean one, which it does not implement and which §2.6 explains. For each: what it measures, on what legal denominator, and what consequence it produces. Every figure is verified against the text of the instrument; the sources are in §7 with their article.
| Regime | Test | Legal denominator | Threshold | Legal consequence |
|---|---|---|---|---|
| Colombia — Ley 358 de 1997 (Law on the borrowing capacity of territorial entities), art. 2 | Debt interest / ahorro operacional | Ahorro operacional = current revenue − operating expenditure − transfers paid (art. 2, parágrafo) | ≤ 40 % | Presumption of capacity to pay: the entity requires no borrowing authorisations beyond those of the laws in force |
| Colombia — Ley 358, art. 6, in the text given by art. 30 of Ley 2155 de 2021 | Interest / ahorro operacional or debt outstanding / current revenue | Both defined in the article itself | > 60 % or > 100 % | Prohibition on contracting new public credit operations, save under the conditions of parágrafos 1 and 2 (risk rating, ministry authorisation, performance plan according to the entity's category) |
| Brazil — Resolução do Senado Federal n.º 40 de 2001 (Federal Senate Resolution), art. 3 | Deuda consolidada líquida (net consolidated debt) / receita corrente líquida | Consolidated debt less cash holdings, financial investments and other financial assets (art. 1, § 1, V); RCL defined in art. 2 | 2.0× states and the Federal District; 1.2× municipalities | If the adjustment period is missed, they become subject to art. 31 of the fiscal responsibility law; during the adjustment, bar on contracting credit operations (art. 5) |
| Brazil — Resolução do Senado Federal n.º 43 de 2001, art. 7 | (i) total amount of the year's operations / RCL; (ii) annual commitment to amortisation, interest and other charges / RCL | Receita corrente líquida (art. 4) | (i) 16 %; (ii) 11.5 % | Authorisation limits for each credit operation. Art. 9 adds a ceiling of 22 % of RCL on the total outstanding stock of guarantees granted, liftable to 32 % under cumulative conditions |
| Peru — Decreto Legislativo 1275 (Legislative Decree on fiscal responsibility and transparency for regional and local governments), art. 6 | (a) total debt outstanding / average total current revenue of the last four years; (b) ahorro en cuenta corriente (saving on current account) | (a) defined in art. 3; (b) total current revenue − total non-financial current expenditure | (a) ≤ 100 %; (b) not negative | Corrective measures under art. 8: preventive monitoring; bar on arranging new short-term borrowing operations; and bar on obtaining the ministry's favourable opinion for a new public-private partnership contract or works-for-taxes agreement involving additional borrowing |
| India — Finance Commission anchor | Interest payments / current revenue of the previous year | The state's revenue-account receipts | ≤ 10 % | Additional borrowing headroom of 0.25 % of state output on top of the 3 % deficit ceiling. Breaching it does not prohibit borrowing: it forfeits the headroom |
| High-income local governments (not a country: it is Austral's own calibration that replaced the set attributed to an agency, §2.3) | Debt burden and debt service | Total revenue | 0.60 / 1.20 and 0.08 / 0.12, declared as the firm's calibration and not as anyone's figure | None. It is neither a legal limit nor a cited market benchmark: it is a screen by this firm for a type of local government, with its reasoning published in the set itself |
| Chile | — | — | — | There is no ordinary borrowing gate, because there is no ordinary borrowing. See §2.6 |
Five observations of method that come out of reading the whole table, and that §3 Step 2 turns into rules.
First: none of these tests measures the same thing as another. Colombia measures interest against a current surplus defined by law; Brazil measures net debt against an aggregate of current revenue with specific deductions; Peru measures total debt against a four-year average; India measures interest against revenue-account receipts. Putting the four in the same column of a spreadsheet and comparing them is the error §6.6 calls "the neighbour's threshold". And it is what any country preset does, without saying so, if it only rewrites cut-offs: §5.2 shows that a set governs only the indicators its source regulates and that the rest stay on the default bands, with the foreign law's label on top.
Second: inside the module, none of the five is computed on the exact denominator of its law, except the two interest gates. The engine computes the Colombian gate on ahorro operacional and the Indian one on current revenue — that is, on their legal denominators — and that is well done. The rest are mapped onto the diagnostic ratios: the Brazilian ceiling is evaluated as gross debt over total revenue when the law says net debt over receita corrente líquida; the Peruvian one, on total revenue for one year when the law says a four-year average. It is a screening approximation, the product declares it with a confidence mark per set, and the manual repeats it where it matters: before any compliance use, the calculation is redone with the legal definitions on audited figures.
Third: the Colombian "traffic light" is not in the text of the law, and its amber light no longer exists. The expression belongs to practice and to the literature — the Fund's own note calls it "the famous traffic-light system" when describing the regime — but the articles of Ley 358 speak of presumption of capacity to pay, of performance plans and of prohibition, not of colours. And there is a fact that changes the reading: arts. 4 and 5, which were the ones regulating the intermediate band between 40 % and 60 %, were repealed by art. 114 of Ley 795 de 2003 — what box 5 of the Fund's note describes, in other words, as the elimination of the amber zone. What is left today is a two-threshold regime with conditional exits: presumption of capacity up to 40 %, and above 60 % of interest over ahorro operacional or 100 % of debt over current revenue, prohibition with the exceptions the parágrafos of art. 6 open according to the entity's category. A manual that draws three lights today is describing a regime that ceased to exist in 2003. The module, by contrast, still labels its Colombian set a "traffic light" on all three client-facing surfaces that describe it, and that product defect remains open and is declared (§5.2). The debt cut-off has been corrected: the set no longer applies the 80 % the law left behind in 2021, but 1.00 as the statutory ceiling with an intermediate cut-off of 0.80 expressly declared as this firm's early warning and not as law. §4.3 measures what the old cut-off was costing on the demonstration pack — one indicator band and no overall rating, which is exactly what allows this kind of defect to survive without anyone noticing.
Fourth: a non-positive denominator is the worst possible result of the test, not a result that cannot be computed. The Colombian gate is measured against ahorro operacional. An entity with no ahorro operacional — negative or zero — is, under the logic of art. 1 of the law, exactly the case the law means to stop: it has nothing out of which to service interest, and its capacity to pay, defined as "the minimum flow of ahorro operacional that allows debt service to be met in full in every year, leaving a remainder to finance investment", does not exist. The engine, today, returns not computable in that case and excludes the gate from the roll-up. It is the entity in the worst shape and the test that should condemn it falls silent (§4.3, §5.7).
Fifth, and it is the one that explains why this manual puts the operating balance among the knockouts: there is a jurisdiction that has already done it. The second Peruvian fiscal rule is not a diagnostic indicator: it is a legal rule requiring that saving on current account not be negative, and breaching it triggers the corrective measures of art. 8, including the bar on obtaining the ministry's favourable opinion for a new public-private partnership. That is: an entire country has already decided that a current deficit in a subnational government is a knockout condition and not a footnote. Austral's calibration agrees with that decision; the exact cut-off, by contrast, is still the firm's, and §4.5 shows the grading defect it carries — a knockout that fires at exactly zero gives High to a balanced current budget and Low to one with a hundredth of a surplus, and can give High to an entity with no debt and no contingent liabilities for half a point of current deficit. It is a criticism the manual makes of its own tool, and §3 Step 4 proposes the correction: grade the knockout by magnitude, or let it set a floor in the middle band, and condition it on non-trivial leverage.
This has to be said precisely, because this firm's commercial offering had been declaring this initiative as the methodological basis of the diagnostic, and it is not.
The initiative exists, it is serious and it belongs to the World Bank: created in 2014, co-funded by the Bank's own public-private infrastructure advisory facility, by the Korean green growth partnership and by a private foundation, it operates along three lines — creditworthiness academies, technical assistance and knowledge products. Its published instrument is called, by that exact name, the City Creditworthiness Self-Assessment & Planning Toolkit, and its declared scope of "local authority" includes municipalities, states and regions and their special-purpose entities: utility operators, municipal banks and subnational public-private partnerships. The initiative also maintains a database of local government borrowing in developing countries, aggregated by country and at entity level.
What the tool does. The local authority answers a questionnaire about its service mandates, its financial management, its financial performance, its planning process and its enabling environment. From those answers the tool derives a list of creditworthiness challenges and assigns each one an intensity from 0 to 100 %, where higher is more severe. The output is an action plan. It is not a credit rating and it does not compute financial ratios.
Why it cannot be the basis of this method. The module in §5 is an engine of six financial ratios with bands, solvency knockouts and a weighted average. The Bank's tool is a qualitative self-assessment instrument scored by challenge intensity. They are two different things with different purposes: one diagnoses practices and environment; the other measures financial statements. Crediting a qualitative instrument as the source of a quantitative engine is exactly the kind of shortcut the discipline of this series has not allowed itself since its first manual, and that is why M10's declared methodological basis is the Fund's note, the OECD framework and the statutory and subnational debt sustainability analysis practice, which is what the engine actually implements.
And what remains of it, which is not little. What the tool covers is precisely the half this method does not cover: the enabling environment and the quality of practices. A subnational government with six clean ratios and a broken budget process is a risk this diagnostic does not see, and section 2.5 of the OECD paper — weaknesses in budget institutions and processes — says that is one of the six risk families. The Fund's note arrives at the same place from another direction: its annex 2 lists the elements of a sound subnational public financial management system — credible budget formulation, a public investment management framework, a fiscal risk management function, budget execution with internal control and cash management, a financial reporting system, an information system, independent external audit and a complete legal framework — and its figure 5 shows that, in the nine countries with public financial management assessments at both levels, subnational scores tend to be lower than national ones, with the sharpest weaknesses precisely in budget formulation and in fiscal risk management.
The operational conclusion, and it is about product and not about the manual: a qualitative layer of environment and practices, built on that initiative's framework, is the natural extension of this module and remains a declared roadmap item. Until it exists, the manual says what it does not assess, and §1.6 counts it among the five figures it delivers — the fifth is "what was not assessed, and why". And the coherence correction this forces: the offering, the module's on-screen manual and this manual have to declare the same basis, which today they do not (§5.8).
The previous table says what the law requires. This one says what the central level does with it: who supervises, whether the supervision is ex ante — prior authorisation of the operation — or ex post — reporting and evaluation, what is published and how often. Structure and practice are cited; no figures of any entity are used. The reference scale for the last column is the one from the fiscal transparency code cited in §2.1: annual is the basic level, annual plus a borrowing limit is good, quarterly is advanced.
| Country | Who supervises | Ex ante / ex post | What is published and how often | Instrument |
|---|---|---|---|---|
| Chile | Subsecretaría de Desarrollo Regional y Administrativo (undersecretariat for regional development); Contraloría General de la República (comptroller general) | Neither, over ordinary borrowing: there is none. Ex post supervision over liabilities and execution | Quarterly report to the council on the monthly detail of accumulated liabilities, broken down into accounts payable of the municipality and of the municipal corporations; public monthly register of the breakdown of expenditure; both available on the municipality's website or on the undersecretariat's portal; quarterly report on budget execution progress from the control unit | Ley 18.695 (Organic Constitutional Law on Municipalities, consolidated text, DFL N.º 1 de 2006), arts. 13, 14, 27 letters c) to f), 29 letter d) and 140 |
| Colombia | Ministerio de Hacienda y Crédito Público — Dirección General de Apoyo Fiscal (ministry of finance, fiscal support directorate) | Ex ante by authorisation once the indicators are exceeded; ex post through performance plans | Quarterly submission to the ministry of the progress of the performance plans; national system for the registration of territorial entities' credit and of the guarantees they grant | Ley 358 de 1997, arts. 6, 9, 10, 12 and 13; art. 30 of Ley 2155 de 2021 |
| Peru | Ministerio de Economía y Finanzas (ministry of economy and finance); Contraloría General de la República | Ex post with an ex ante consequence: the corrective measures bar new operations | Quarterly monitoring report on finances and on compliance with the fiscal rules, within 45 days of the quarter's close; annual compliance evaluation report, submitted to Congress; list of entities subject to corrective measures, published by ministerial resolution | Decreto Legislativo 1275, arts. 6, 7, 8 and 10 |
| Brazil | Senado Federal (the Federal Senate sets the limits); Ministério da Fazenda (the finance ministry receives the data) | Ex ante: each credit operation is authorised against the limits | Ratio of net consolidated debt to receita corrente líquida every four months, recorded in the fiscal management report of the fiscal responsibility law; data submitted to the ministry within 30 days of the reference date | Resolução do Senado Federal n.º 40 de 2001, arts. 3, 4 and 5; n.º 43 de 2001, arts. 7 and 9 |
| Mexico | Secretaría de Hacienda y Crédito Público (finance secretariat) | Ex post with an ex ante consequence: each category's Net Financing Ceiling caps new borrowing, and the most severe level takes it to zero | Sistema de Alertas (Alert System) published permanently on the secretariat's site: updated quarterly for federated entities (within 60 calendar days of the quarter's close), semi-annually for municipalities (within 90 days) and annually for other public entities; classifies each entity into one of three debt levels with its associated net financing ceiling | Ley de Disciplina Financiera de las Entidades Federativas y los Municipios (Financial Discipline Law), arts. 44, 45, 46, 47 and 48 |
| India (reference row from outside the region) | Union government ministry of finance — Department of Expenditure | Ex ante: each state's net borrowing ceiling is consented to by the centre | The consent and the additional headroom are determined from the figures in the state's finance accounts of two years earlier | Finance Commission recommendation (paragraph 14.64 of the Fourteenth Commission's report), applied by the Union government |
Five readings of the table, in the order the manual uses them.
Chile is the most interesting row in the manual, and the reason is that there is no debt there to measure. Municipal assets are listed exhaustively in article 13 of the consolidated text of the organic constitutional law of municipalities: corporeal and incorporeal property, the regional government's contribution, income from the Fondo Común Municipal, fees for services, permits and concessions, income from its own activities and establishments, the taxes of clear local identification the law allows — property tax, vehicle circulation permits, business licences — fines and interest accruing to the municipality, and such other income as the laws in force assign to them. There is no paragraph on borrowings, on debt or on credit operations, and the word "credit" does not appear once in the full text of the law. Article 140 closes the door from the side: "No municipal corporation, foundation or association, created or to be created under this or other laws, may contract borrowings." The regime of the regional governments follows the same pattern: article 69 of the consolidated text of their organic law lists regional assets — property transferred by the Treasury, property acquired and its fruits, donations, inheritances and legacies, income from services and from permits and concessions, income under article 19 No. 20 of the Constitution, the resources of the Fondo Nacional de Desarrollo Regional, the obligations it contracts in the course of its activities in accordance with the law, the rights and obligations arising from its participation in associations, and such other resources as the law provides — with no paragraph on borrowings; and its article 101 provides that the regional government's contribution to corporations and foundations may not be financed by contracting borrowings, and that regional governments may not guarantee or secure the financial commitments of those entities, nor do those commitments give rise to any action for payment against them.
The consequence for the method is the one the box in §4.7 sets out and the product decision §5.7 calls for: for a Chilean subnational government, the two heaviest indicators in the engine — debt burden and debt service, the latter also a knockout — measure something the legal framework does not contemplate as an ordinary source of financing. A portfolio of Chilean municipalities screened today would return a flat list on the two indicators that weigh most, and would give a clean bill of health to whoever cannot pay their suppliers. And it would not see what the Chilean municipality actually carries: its deuda flotante — the difference, at year-end, between total expenditure accrued in the year and total payments corresponding to that expenditure; that is, accrued expenditure left unpaid, which is neither accumulated debt nor overdue debt — the deficits of the transferred health and education services, and its court-ordered obligations. The general rule §2.7 draws from here: a Low on debt burden because the law prohibits borrowing is not good news, and the screen must declare those indicators not applicable instead of rewarding them.
And one point about the data source, because the question asks itself: there is enough public information for a Chilean case, and it does not come from a national budget body. The legal obligation it derives from is in article 27 letters c) to f) of the organic law: the administration and finance unit must report quarterly to the council the monthly detail of accumulated liabilities, broken down into accounts payable of the municipality and of the municipal corporations — which are obliged to report their financial position to it with that breakdown — keep a public monthly register of the breakdown of expenditure, submit it to the undersecretariat, and publish the quarterly report and the monthly register on the municipality's website or, failing that, on the undersecretariat's portal. That undersecretariat's national municipal information system is where this is consolidated and published, with a budget classifier, a dictionary of variables, a dictionary of indicators, a commune fact sheet and a download centre. One warning about its coverage, verified as at the closing date of this edition: the system's indicator and variable menus are offered for the period 2001-2013 and the budget classifier for 2008-2013, while the system's institutional publication compiles information for 2021-2024. Anyone about to build a series on that source must verify the coverage field by field before committing to a financial year; §4.7 says so where it belongs.
Colombia is the only one of the five that combines all three things: a legal gate with a consequence, an authorisation system with a performance plan, and a national register of credit and of the guarantees granted by territorial entities. That register is precisely what Step 5 of this manual asks for on contingent liabilities and what almost no country has. Its regime is also the most cited in the comparative literature: the Fund's note devotes a whole box to it and places it within a wider set — quantitative limits on operating expenditure under Ley 617 de 2000, a territorial insolvency regime under Ley 550 de 1999, financial planning and budgeting rules under Ley 819 de 2003, and a prohibition on the Nation guaranteeing subnational domestic debt — and records that the fiscal responsibility law further prohibits the Nation from lending to or guaranteeing a territorial entity that is in breach of the limits or in arrears with the government, with invalidity of the credit contract and restitution of the funds as the sanction. It is the example §3 Step 2 uses to show what it means for a gate to have a consequence.
Peru is the regime that most resembles this manual's method, and so it is worth looking at: its two fiscal rules are exactly a stock indicator and a current-account indicator; its assessment is annual with quarterly monitoring; its consequences are graded — preventive monitoring, bar on short-term borrowing, bar on a favourable opinion for a new public-private partnership; and the list of affected entities is published. A ministry wanting to build what §3 describes has here the closest institutional model.
Brazil is the stock-ceiling regime with a glide path, and it teaches something §3 Step 9 needs: the net consolidated debt limit was set with an adjustment period of fifteen financial years counted from the close of the year the resolution was published, with a minimum reduction of one fifteenth of the excess per year and measurement every four months recorded in the fiscal management report. That is, the ceiling did not arrive all at once: it arrived with a trajectory, with a monitoring metric and with a sanction for departing from the trajectory — a bar on contracting credit operations for as long as the irregularity lasts. It is the design The Pipeline Under the Ceiling describes for the central level, applied one level down.
Mexico has the alert system closest to this manual's method of any that exists, and it is now cited by article. The Financial Discipline Law measures each public entity with three indicators (art. 44): debt and financial obligations over freely disposable revenue; the service of that debt over the same base; and short-term obligations and payables, net of cash and banks, over total revenue. With these it classifies the entity into three levels — sustainable, under observation, high — (art. 45) and ties each level to a Net Financing Ceiling: 15% of freely disposable revenue if sustainable, 5% if under observation, zero if high (art. 46); an entity that lands in the high level must sign a fiscal-responsibility agreement (art. 47). A point that corrects both the earlier edition of this manual and the Fund note that summarised it: the Alert System's publication frequency is not uniformly quarterly — article 48 sets it at quarterly for federated entities, semi-annual for municipalities and annual for the remaining public entities. What still cannot be verified against the Law's text — and is confirmed only through the Fund's note, which cites the Government of Mexico — is that an entity defaulting on its financial obligations is automatically classified at the most severe level: article 44 refers that level of detail to administrative provisions the secretariat issues, which were not opened. With the Law's text available, Mexico now enters the table above with its own row.
Six rules are this firm's own. None of them contradicts the sources above; all of them say something the sources do not say, because the sources write for a supervisor and this manual writes for whoever has to produce a number and defend it.
(i) The legal gate is separated from the diagnostic indicator, always, and published in different vocabulary. An indicator produces a band; a gate produces a legal situation — may borrow, may borrow with authorisation, may not borrow. §3 separates them into two steps and never averages them. The reason is defensive: on the day the decision is reviewed, what holds up the authorisation is the calculation made on the law's denominator, not the screen.
(ii) The absence of financial debt is not good news when the jurisdiction prohibits it. It is the rule that comes out of the Chilean row and it holds for any equivalent regime. A debt burden indicator that returns Low because there can be no debt is not measuring: it is returning a property of the legal order dressed up as a property of the entity. The correct treatment is to declare it not applicable, redistribute the weight to the indicators that do measure — autonomy, operating balance, liquidity and accrued and unpaid obligations — and publish the resulting coverage.
(iii) The perimeter of what the sovereign really owes. It is the thesis of The Anchor and the Perimeter applied one level of government down: what a State owes is not what its debt register says, but what its perimeter contains. At the subnational level the perimeter is more treacherous than at the central one, because "the municipality" is almost never a single set of accounts: there is the central administration, there are transferred services, corporations and foundations, utility companies and, in some jurisdictions, separate funds. Diagnosing the central administration of a municipality whose deficit lives entirely inside its health corporation is the most expensive error of Step 0.
(iv) Risk retention as a decision and not as an inheritance. The Optimal Risk-Retention Frontier holds that a ministry of finance must decide explicitly which risk it retains. Applied here: the central level does in fact retain the subnational risk it transferred to nobody — the implicit rescue — and it retains it without having decided it and without having put it in a budget. Step 7 forces that retention to be written down channel by channel; Step 8 forces it into the fiscal risk statement. It is the same direction the Fund's note points in when it says recording maximum exposure is enough, and the OECD paper when it asks for a fiscal risk annex.
(v) The correlated portfolio. N subnational governments in the same country share the business cycle, the transfer formula and, often, the price of a commodity. Their risks are not independent, paragraph 30 of the OECD paper says so for the risk families and Stress-Testing PPP Portfolios models it for a portfolio of contracts. The operational consequence in Step 6: the sum of worst cases assumes perfect correlation and is published as an upper bound, with that label.
(vi) Flow ceilings and stock ceilings, and how a portfolio is run under a live ceiling. The Pipeline Under the Ceiling separates the ceiling that limits the stock from the one that limits the annual flow and shows that running a portfolio under a live ceiling is a problem of ordering, not of addition. The Brazilian regime in the previous table is the statutory version of that problem: a stock ceiling with a fifteen-year glide path, and an annual flow ceiling on operations, which are two different constraints on the same entity.
And the note this manual is obliged to write. Austral has no published paper on subnational fiscal risk. The research idea the firm had in this territory — the subnational public-private partnership gap — was abandoned in June 2026 for a null result: the test gave no consistent direction, and the record of that decision left it in writing that there is no clean documented case of central-level absorption of a state or provincial public-private partnership. This manual is the methodological note that decision left standing, and it is the firm's first text on the terrain.
Saying so is better than implying support that does not exist, and it is also the argument. A null result on this terrain is not an accident: it is the same finding the Fund's note makes when it discovers that half the countries evaluated have no information on their subnational finances, and the one the OECD paper makes when it says its analysis is mostly qualitative and normative, with only anecdotal references to good practice, because no national or comparative databases exist on the incidence and management of subnational fiscal risks, and calls for a start to be made on building them. The manual's two principal sources declare the same hole. On terrain like that, a method that declares what it did not measure is worth more than one that promises coverage, and that is exactly the fifth figure §1.6 promises to deliver.
| Step in §3 | Source that backs it | Screen in §5 |
|---|---|---|
| 0 — Perimeter and exclusions | OECD §3.1.1 (identification of vulnerabilities and dispersion of information); Fund's note, annex 2 (reporting coverage) and its requirement to cover the whole of general government | No screen |
| 1 — The accounts and their quality | Fund's note, annex 1 (the ratios and their inputs) and annex 2 (financial reporting system); OECD §2.5 (budget weaknesses) | Risk Assessment — budget, balance sheet and current account blocks |
| 2 — The statutory gate | The five regimes of §2.4, each in its article; Fund's note, table 1 and box 5 | Risk Assessment — threshold set selector (only if the set introduces it) |
| 3 — The six indicators | Fund's note, five dimensions and annex 1; Austral calibration (§2.3) | Risk Assessment — indicator table |
| 4 — Roll-up to a single rating | Weighted profile structure documented in the Fund's note (footnote 9 and box 3); knockouts and weights, Austral calibration | Risk Assessment — overall rating and flags |
| 5 — Contingent liabilities and obligations that are not financial debt | OECD §2.4 and ¶43 (inventory at face value); Fund's note (arrangements and off-budget debt) | Risk Assessment — a single aggregate field; no breakdown |
| 6 — Portfolio reading | OECD ¶30 (correlation); Austral, Stress-Testing PPP Portfolios | Batch Compare — with five indicators, not six |
| 7 — The bridge to the central level | Fund's note, III.A "Quantifying Risk" (maximum exposure by category, short and long term) and III.C (the rule against assigning published probabilities); OECD ¶53; Austral, The Recognition Rule, The Optimal Risk-Retention Frontier, The Useful Silence | No screen |
| 8 — The destinations of each figure | Fund's note, III.D and box 7 (fiscal transparency code); OECD ¶52 (fiscal risk annex) | No adapter towards the Fiscal Risk Statement (M9) |
| 9 — Governance, monitoring and updating | Fund's note, conclusions (dedicated unit in the ministry) and annex 2; OECD ¶32 and ¶36 (focal point and fragmentation of authority) | Threshold and preset library; risk scorecard report |
The inverse table — screen by screen, with what goes in and what comes out — is in §5.1.
Ten steps, from the perimeter to monitoring. Each one declares what goes in, what comes out and what the rule is — the rule is what makes the step reproducible by another analyst with the same data. The skeleton is the OECD risk management cycle — identify, analyse, mitigate, transfer or share, and responsibly accommodate the residual (§2.2) — unfolded into ten operational steps: Steps 0 to 3 identify, Steps 4 to 6 analyse, Step 7 measures the retention, and Steps 8 and 9 disclose and govern.
The method is written to be executed with any tool. A spreadsheet and a folder of evidence are enough, and that is the condition for §6 to be able to show afterwards where that spreadsheet breaks. Where the practice of the module in §5 departs from the source, or where the module does not yet run the step, it is said in the step and repeated in §5. Two steps — Step 0 and Step 7 — have no screen today that runs them, and they are taught all the same, because they are the first and the most consequential.
Four conventions govern the ten steps. It is worth fixing them first, because each one is a common error written the other way round.
(1) A datum that does not exist is not a zero. An unreported revenue item, blank short-term obligations, a guarantee inventory nobody drew up are left empty, and every indicator that needs them returns not computable and counts as a data gap. Writing a zero is asserting that the figure is zero. The distinction looks like form and it decides results: a missing datum scored as a zero unfairly lowers a rating, and a missing datum ignored raises it — and the second error is the worse one, because it rewards the entity that reports least.
(2) The three obligations are not added up without a label. Financial debt — bank credit, bonds, finance leases — accrued and unpaid obligations — expenditure accrued in the year that is unpaid at the close; the deuda flotante of Chilean law — and contingent liabilities — guarantees, enterprises and services, litigation — are all debts in the ordinary sense of the word and they have different enforceability, different maturity and different accounting treatment. The method measures them separately and adds them only when it says explicitly what it is adding and why.
(3) A legal gate is not a diagnostic indicator. The gate produces a legal consequence — may borrow, may borrow with authorisation, may not borrow; the indicator produces a reading. They resemble each other in the arithmetic and in nothing else. The method separates them into two distinct steps, publishes them in different vocabularies and never averages them (§2.7).
(4) Every figure comes out with its base and its date. A ratio that does not say on what denominator it was computed, and a figure that does not say which closing date it refers to, are not auditable. This is the convention Step 9 turns into mandatory fields of the register.
In: the name of a subnational government, and the list of the entities linked to it — its organisation chart, its budget annex, the register of its corporations and foundations, the register of its utility companies, and the entities none of those lists contains but whose deficit ends up in its budget.
Out: the written definition of what is being measured, with its list of exclusions. Each exclusion with its reason and, where material, with an order of magnitude. The second list is as much part of the deliverable as the first.
The rule governing this step is a single one and it is stated before the cut-offs: the perimeter is decided before measuring and published with the result, because nothing distinguishes "there is no risk" from "we did not look". (Austral, The Anchor and the Perimeter.)
A subnational government typically has five layers, and all five can generate obligations that end up in its budget:
| Layer | What it is | How the obligation arrives |
|---|---|---|
| Central administration | The entity's budget proper | Directly: it is what almost every register measures |
| Transferred services | Functions devolved from the central level — primary health, education — operated by the entity, with own, transferred or mixed funding | The operating deficit, which the central administration either covers or leaves unpaid |
| Corporations and foundations | Private-law legal persons created by, or participated in by, the entity to deliver services | The contribution needed to keep them going, the accrued liability they build up and — where the law allows it — the guarantee the entity gave them |
| Enterprises and utilities | Water, waste, transport, parking and market companies | The capital contribution, the tariff subsidy and the guarantee |
| Separate funds and estates | Staff pension funds, contingency funds, earmarked estates | The actuarial deficit and the unbudgeted commitment |
The classic trap of this step, and the most expensive error of the whole method: diagnosing the central administration of a municipality whose deficit lives entirely inside its health corporation. The operating balance indicator of the central administration comes out clean, the overall rating comes out low, and the obligation the central level will end up paying sits on a balance sheet the diagnostic never opened. It is the exact subnational analogue of measuring a state-owned enterprise's guaranteed debt and calling it the State's exposure.
The order matters: each cut assumes the previous one has already been applied.
(a) Is it a unit with accounts of its own? A department with no separate accounts is not diagnosed separately: it is consolidated with the entity that administers it. A corporation with legal personality, a budget and statements of its own is a unit, and the decision whether to consolidate it belongs to the next cut.
(b) Is it inside this entity's perimeter, or another's? The criterion is who ends up paying, not who appears as a founder. A corporation created by three municipalities and serving all three is apportioned, and the apportionment criterion is declared. A utility company whose tariff is set by the national regulator and whose deficit is covered by the central level is not in the municipality's perimeter even if the municipality is its shareholder: it is in the central level's, and that is said.
(c) Is it consolidated, estimated or excluded? Three exits, and none of them is "not mentioned":
(d) Does it cross into another level of government or another manual? Two boundaries that have to be written down before measuring, because they are the two routes by which an obligation gets counted twice:
The deliverable of Step 0 is a written page, not a figure: the entity's name, the layers included with their consolidation basis, the layers estimated with their estimate and its method, the layers excluded with their reason, and the date of the organisation chart it was built on. It is filed with the result and looked at again the following year, because a perimeter that changed without being declared invalidates the year-on-year comparison (Step 9).
[to be built]: the module has no perimeter block. Its entity model is a name and twelve figures, and there is no field for the layers, for the consolidation basis or for the list of exclusions. Until one exists, the analyst writes this page outside the tool and attaches it to the report — and the report, which today does not carry it either, should.
In: the budgetary and financial statements of the entity and of the layers consolidated in Step 0, at the close of the latest available financial year.
Out: the twelve inputs of the diagnostic, each with its declared basis, and the gap sheet: which input could not be obtained and which indicator is therefore left uncomputed.
The twelve inputs, grouped as the method groups them:
| Block | Input | What exactly it is |
|---|---|---|
| Revenue | Total revenue | All the year's revenue, current and capital |
| Own revenue | What the entity controls: taxes of local identification, fees, permits, concessions, income from its establishments | |
| Transfers | What is received from other levels of government, by formula or by decision | |
| Current revenue | The current account of revenue: excludes capital revenue, asset sales and credit disbursements | |
| Expenditure | Operating expenditure | The year's running expenditure |
| Current expenditure | The current account of expenditure: staff, goods and services, transfers paid, interest | |
| Debt | Debt outstanding | The stock of financial debt at the close |
| Debt service | Amortisation plus interest paid in the year | |
| Interest | Only interest, without amortisation | |
| Liquidity | Liquid assets | Cash, equivalents and financial investments immediately available |
| Short-term obligations | Liabilities falling due within the following year | |
| Contingent liabilities | Contingent liabilities | The total of the Step 5 inventory, at face value |
(a) The current account is separated from the capital account. It is the most important rule of the step and the one most often skipped. The balance that matters for solvency is the current one: if current revenue does not cover current expenditure, the entity is funding operations out of capital, out of debt or out of non-payment, and none of the three is sustainable. The worst combination there is — and the one an overall balance hides — is an overall surplus with a current deficit: the entity closes the year in the black because it did not execute its investment, while its operations lose money. A screen looking only at the overall balance reads it as healthy.
(b) Accrual and cash are not the same thing, and the difference between them is a liability. Expenditure accrued in the year that was unpaid at the close is a certain obligation, merely delayed. It is not a contingent liability: it is a debt with no credit contract. In several jurisdictions — those that do not allow ordinary subnational borrowing — it is the entity's dominant obligation, and the only register that contains it is the liabilities register, not the debt register. It is measured, it is declared and it is not added to financial debt without a label.
(c) Interest is separated from total service. The statutory gates of several countries are measured on interest only, because in their accounting amortisation is a capital item and not a charge of the year. Supplying total service where the law asks for interest overstates the ratio and can turn an entity that passes the gate into one that does not — or, worse, make it look as though the gate was computed when something else was (§2.4).
(d) Transfers are not own revenue. Putting them in the numerator of autonomy destroys the indicator and switches off exactly the alert it should switch on: a wholly dependent entity comes to read as autonomous. The separation is made in the input, not in the formula, because a well-written formula on a badly built input still gives the wrong result.
(e) The identities are checked. Five of them, and none is optional:
A breach of any of the five is a soft alert: it does not invalidate the diagnostic, but it is published alongside it, because a ratio computed on an input that does not tie is not a result, it is an arithmetic operation.
A single financial year does not say whether the entity is deteriorating. Subnational solvency is a trajectory: a current balance that narrows three years running says more than its level in one; a stock of accrued unpaid expenditure that grows says more than its ratio over revenue; and debt service with bunched maturities is not visible in the year's ratio. The method asks, where the data exist, for two to five financial years per entity, and for the result to be published with the change and direction of each indicator.
[to be built]: the module accepts a single period per entity. There is no series, no change, no projection; the module's own on-screen manual declares the limitation. Until that changes, the trend reading is done outside the tool — running the assessment once per financial year and comparing the outputs — and the report says that the rating is a snapshot.
And what the ideal tool would do, said here because it is method and not product. It would take a series per entity and not one financial year, and publish three things that do not exist today. (i) The change and direction of each of the six ratios between the first year and the last, because an autonomy of 0.45 that comes from 0.60 and one that comes from 0.30 are two different entities with the same number. (ii) A trend band alongside the level band — improving, stable, deteriorating — built with a declared rule and not with judgement, because if the trend band is arguable the user will argue about it instead of using it. (iii) The Step 9 reconciliation between two runs, which today is done by hand: how much of the difference comes from entities that entered or left, how much from a perimeter change inside an entity, how much from a change of thresholds or of legal regime, and how much from the figures having changed. That fourth cause is the only one that means the portfolio got worse; the other three mean it was measured differently. This is work for the second edition of this manual, and it is written here so that whoever builds the series knows what will be asked of it.
[to be built], and it is the cheapest hole in the module to close: there is no cross-validation at all. Each field is validated as non-negative and nothing more. Checked against the engine: own revenue of 1,500 with total revenue of 1,000 returns an autonomy of 1.50, rated as the best possible result of the indicator, without a word of warning. Nor is it checked that own revenue plus transfers ties with the total, or that current revenue does not exceed the total.
And a second hole in the same step, subtler: supplying only one leg of the current-account split leaves the operating balance not computable, when the other two inputs would allow a fall-back to the gross operating margin. Checked: an entity that supplies current expenditure and does not supply current revenue loses the whole indicator instead of losing precision.
There is also an interface limit that bears directly on convention (1) of this method: the form cannot say "not reported". An empty numeric field becomes a zero before it leaves the screen, on both screens of the module. So the discipline the engine implements — missing denominator, indicator not computable — cannot be reached from the interface: it is only reached by leaving the field at zero, which is exactly what the convention forbids asserting. Until this is corrected, the operating rule is: a zero in the form means "zero" only if the analyst wrote it on purpose, and the fields that are not known are noted in the Step 1 gap sheet and their indicator is discarded by hand when reading the result. It is a patch, it has to be said that it is one, and §6 uses it as the argument it is.
In: the entity's jurisdiction and the figures from Step 1.
Out: the result of the legal test that governs its borrowing, if one exists, with its legal consequence and the denominator it was computed on.
It is the hinge step of the manual and the section where the method parts from a credit analysis. A credit analyst does not need this step: what the law authorises is of no interest, what matters is whether the debt is paid. A unit that authorises credit operations has no such freedom — its product is the authorisation, and the authorisation rests on the calculation made on the law's denominator.
A gate does not return a band. It returns one of these three things, and it is published in these words:
| Result | What it means |
|---|---|
| Presumption of capacity to pay | The entity may contract without authorisations beyond the general ones |
| Subject to authorisation or to a plan | It may contract on meeting a condition: ministry authorisation, risk rating, performance plan |
| Prohibited | It may not contract new credit operations |
And two results that are neither bands nor legal situations, and that have to be told apart carefully because the error of confusing them is the central defect of this step:
Each regime measures a different thing on a different denominator, and none is interchangeable with its neighbour (§2.4). Colombia measures interest against a current surplus defined by law — ahorro operacional: current revenue less operating expenditure less transfers paid — and also debt outstanding against current revenue. Brazil measures net consolidated debt against receita corrente líquida, and separately the annual commitment to amortisation, interest and charges against the same base. Peru measures total debt against the four-year average of current revenue, and separately requires that saving on current account not be negative. India measures interest against revenue-account receipts.
The rule states itself: the gate is computed on its own denominator, not on the diagnostic's. And when that denominator is unavailable and a substitute has to be used, it is said which one, why, and in which direction it biases. A declared substitute is a screening approximation; an undeclared substitute, published under the name of the law, is a false statement about the legal situation of a government.
And the closing rule, repeated in §5 because that is where it matters: before any compliance use, the calculation is redone with the legal definitions on audited figures. A screen does not authorise a credit operation.
The Colombian gate is measured against ahorro operacional. An entity with no ahorro operacional — negative or zero — is, under the logic of the law itself, exactly the case the rule means to stop: its capacity to pay, defined as the minimum flow of ahorro operacional that allows the debt to be serviced every year while leaving a remainder for investment, does not exist. It has nothing out of which to pay interest.
Arithmetically, the ratio with a zero or negative denominator is undefined. Legally, the result is the gravest the test can give. The method's rule: non-positive ahorro operacional, with positive interest, is a breach of the gate, it is published as such and it carries the legal consequence the law provides for a breach, with a note explaining that the quotient could not be computed and why that aggravates rather than mitigates.
[to be built]: the module returns not computable in that case and excludes the gate from the roll-up. It is the entity in the worst shape, and the test that should condemn it falls silent. The product's reasoning — that the operating balance indicator already flags it — is true only if the entity supplied the current-account split; the entity that supplies interest and does not supply the split triggers neither of the two.
There are jurisdictions with no subnational borrowing gate because they have no ordinary subnational borrowing: the law lists the entity's assets exhaustively and does not include borrowings (§2.6). In those cases:
This is the case of the first market of the firm's subnational line of work, it is verified against the articles, and §4 devotes a box to it. [to be built]: the module has no threshold set for a regime of that kind, and no indicator of accrued and unpaid obligations. Today a portfolio of those entities screened with the default bands returns a flat list on the two indicators that weigh most.
It is the normal case, not the exception: three of the five regimes in §2.4 have two tests. The rule: each test is computed and published separately, and the entity's legal situation is the worse of the two. They are not averaged, not combined into an index and not reported by whichever one was passed. Two tests measuring a stock and a flow — such as the Brazilian debt ceiling and annual operations ceiling — are two different constraints on the same entity, and an entity can be under the stock ceiling and out of flow headroom, or the other way round (Austral, The Pipeline Under the Ceiling).
And a note about the vocabulary practice uses and the law does not. The Colombian regime is known as "the traffic light", and the comparative literature calls it that too; but the articles speak of presumption of capacity to pay, of performance plans and of prohibition, not of colours, and the amber light ceased to exist when the intermediate band lost its own rule in 2003 (§2.4). The method uses "traffic light" as the name by which the regime is known and does not draw three lights, because drawing them today is describing a regime that no longer exists.
In: the inputs from Step 1.
Out: six ratios, each with its value, its band, its direction and its weight; plus the coverage of the diagnostic — how many of the six could be computed.
The six, with the way they are computed, the two default cut-offs, the relative weight and knockout status:
| # | Indicator | Formula | Direction | Medium | High | Weight | Knockout |
|---|---|---|---|---|---|---|---|
| 1 | Revenue autonomy | own / total | lower is worse | ≤ 0.60 | ≤ 0.30 | 1.0 | no |
| 2 | Debt burden | debt outstanding / total revenue | higher is worse | ≥ 0.50 | ≥ 1.00 | 2.0 | no |
| 3 | Debt service | (amortisation + interest) / total revenue | higher is worse | ≥ 0.075 | ≥ 0.10 | 3.0 | yes |
| 4 | Operating balance | (current rev. − current exp.) / current rev. | lower is worse | ≤ 0.05 | ≤ 0.00 | 3.0 | yes |
| 5 | Liquidity | liquid assets / short-term obligations | lower is worse | ≤ 1.50 | ≤ 1.00 | 2.0 | no |
| 6 | Contingent liabilities | contingent liabilities / total revenue | higher is worse | ≥ 0.20 | ≥ 0.50 | 1.5 | no |
Where each ratio comes from and what part of the table is this firm's calibration is in §2.3, indicator by indicator. The reading rule, in one line: the source backs the ratio; the cut-off is chosen by the firm. Whoever wants to argue about the 0.075 argues with Austral and not with an international body.
An indicator without its mode of gaming is half a lesson. The six, in the same order:
1 · Revenue autonomy. Measures how much of the budget the entity controls, and by complement its exposure to a cut or to a change in the transfer formula — which in several jurisdictions is the dominant risk of the small municipality. How it is gamed: by putting transfers in the numerator; by counting as own revenue the proceeds of a concession that is really an advance on debt; or by treating as own a tax the entity collects but does not keep. How it is defended: identity (e)1 of Step 1, and reading the list of taxes against the rule that creates them.
2 · Debt burden. Measures how many years of revenue the stock represents. How it is gamed: by leaving out finance leases, the debt of the corporations inside the perimeter and the debt to the central level — which is debt; or by measuring against revenue inflated by an extraordinary capital receipt. How it is defended: the Step 0 perimeter and the declared denominator. And the reading rule this manual requires: this indicator is not read alone. It is measured against total revenue and not against own revenue — the denominator decision is argued in §2.3 and is this method's declared divergence from the annex of ratios of the Fund's note — and the cost of that decision is that it does not see that an entity's transfers can be cut. The mitigation is not one of formula, it is one of method: debt burden is read together with autonomy, always. An entity with a debt burden of 0.7 and autonomy of 0.25 is a different risk from another with the same burden and autonomy of 0.8, and the pair shows it where the ratio alone does not.
3 · Debt service (knockout). Measures the part of the year's revenue that is already committed to amortisation and interest. It is the indicator closest to cash and that is why it is a knockout: an entity that cannot service its debt is a high risk however clean the other ratios are. How it is gamed: with a grace year, with a recent rescheduling or with a maturity structure bunched further out — all three lower the year's service and do not lower the obligation. How it is defended: by asking for the maturity profile and using maximum future debt service instead of the year's when the debt has grace, bunched payments or introductory rates that reset. The Fund's note itself warns of this in its annex of ratios (§2.1); the method takes it up as a rule and the module does not implement it — there is no maximum-future-service field. [to be built]
4 · Operating balance (knockout). Measures whether operations are paid for out of operating revenue. It is the reason the method starts from the current account, and there is a jurisdiction that has already turned it into a legal rule (§2.4). How it is gamed: by classifying current expenditure as investment — the budget classifier leaves room and the temptation is constant; by accruing less than was executed; or by leaving the year's invoices unaccrued, which improves the year's balance and creates an obligation that shows up in the next one. How it is defended: by cross-checking the current balance against the change in accrued unpaid expenditure. If the current balance improves and accrued unpaid expenditure grows, the balance did not improve: it was shifted. It is the most useful check in the whole method and the one fewest registers make.
5 · Liquidity. Measures whether the entity can pay what falls due this year. It is the ratio that moves fastest and the one that anticipates payment arrears before they show up in any other indicator. How it is gamed: by counting as liquid a deposit earmarked for a specific purpose, or a balance of third-party funds; or by leaving out of the denominator accrued unpaid expenditure, which is enforceable. How it is defended: by declaring what was counted as liquid and what was counted as enforceable, with both lists.
6 · Contingent liabilities. Measures the size of the Step 5 inventory relative to revenue. How it is gamed: by omission, which is the dominant form — an incomplete inventory returns a low ratio and a comfortable entity; and by aggregation, adding face-value guarantees to expected enterprise deficits, which are figures of a different nature. How it is defended: with the Step 5 breakdown published alongside the ratio, and with the warning that face value is not an expected loss.
(a) The operating balance has two versions and they are not the same figure. The current balance proper — current revenue less current expenditure, over current revenue — is the one the agencies publish and the one the operating performance dimension of the Fund's note describes. When the entity does not supply the current-account split, what can be computed is a gross operating margin over total revenue, which is a different measure: its numerator includes capital revenue and so does its denominator. The method requires declaring which of the two was published, and §4 shows the difference with numbers. Publishing a gross margin and calling it the current balance is the most expensive labelling error of the step, because both are compared against the same cut-off and they should not be.
(b) An indicator that cannot be computed is not computable, and it carries an incomplete-assessment flag. Never a zero, never the low band. The overall rating is published with its coverage, and an entity with three indicators out of six is not comparable with one that has all six, however much the two of them say "Medium".
[to be built]: the module keeps that rule on five of the six indicators. Liquidity without short-term obligations disappears silently: the indicator is not built, it does not appear as not computable, it does not enter the list of incomplete-assessment flags and it is not deducted from the coverage. Checked against the engine with the same entity: with no short-term obligations it returns five indicators, zero flags and a low rating; supplying a liquidity of 0.50 returns six indicators, one flag and a medium rating. Supplying the datum worsened the profile, and the version with less information carried no sign of incompleteness. It is exactly the error convention (1) of this method exists to prevent, committed by the tool that implements it, in one case out of six.
It is worth saying here because the number appears on the product's landing page and in this manual, and the two have to agree. The diagnostic has six indicators. The statutory gate of Step 2, where the regime defines one, is scored as well, with its own weight and — in one case — with knockout status. So an entity assessed under a statutory regime has seven or eight scored ratios, not six: the six of the diagnostic plus the gate of interest over the current surplus, or of interest over current revenue, depending on the regime.
This manual's position: both numbers are stated and the names are not mixed. "Six diagnostic indicators, and up to two statutory gates depending on the applicable regime." The gates are not called indicators anywhere in the text, because Step 2 exists precisely so that they are not confused. [to be fixed]: the module's landing page publishes "six" in all four of its editions, and its information service returns a list of six, while the engine can score eight.
In: the bands of the computed indicators, and the statutory gate if the regime defines one.
Out: an overall Low / Medium / High rating, with the reason for its level and with its coverage.
The roll-up has two stages and the order is not negotiable.
A high band on a solvency indicator is not averaged: it forces the result. The reason is one of substance and not of arithmetic: an entity that cannot service its debt, or whose operations lose money, is a high risk however clean the other ratios are, and an average that dilutes that failure down to the low band is giving a false answer. The product's term is knockout, and this edition uses the product's word: solvency knockout.
Three tests are knockouts, not two, and the manual has to say all three because the product today names two:
| Knockout test | Why it is one |
|---|---|
| Debt service | It is the year's obligation against the year's revenue |
| Operating balance | With no current surplus there is nothing out of which to service anything, and there is a jurisdiction that made it a legal rule |
| Gate of interest over the current surplus | Because breaching it prohibits borrowing: it is not a reading, it is a consequence |
And one that deliberately is not one, and it is worth explaining why because it is the right decision and it is not obvious: the gate of interest over current revenue of the Indian regime. Breaching it forfeits additional borrowing headroom without prohibiting borrowing — the regime grants extra headroom to whoever meets the anchor, it does not take headroom away from whoever does not. A test whose consequence is losing a flexibility is not of the same order as one whose consequence is a prohibition, and treating them alike would import into the rating a severity the law does not have. It is weighted with the weight of the solvency tests and it does not force the result.
The indicators that did not trigger a knockout are combined with declared severity weights, never with a simple mean. The bands are converted into levels — low 1, medium 2, high 3 — averaged with the weights from the Step 3 table, and the average is mapped to a band: 2.5 or more is high; 1.75 or more is medium; below that, low.
The weights sort the indicators into three classes, and the class is the argument: solvency — debt service, operating balance and the interest gates, weight 3.0; leverage and liquidity — debt burden and liquidity, weight 2.0; and informational — autonomy, weight 1.0, and contingent liabilities, 1.5. Contingent liabilities weigh more than autonomy because they can turn into cash and autonomy cannot; and they weigh less than debt because they may not materialise.
Indicators that cannot be computed are excluded from the average and counted. They enter neither the numerator nor the denominator: the rating is built with what there is and comes accompanied by how many indicators built it. It is the rule of Step 3 (b) applied to the roll-up, and it is what makes coverage part of the figure rather than a footnote.
A badly graded knockout produces jumps a municipal council is not going to accept, and they have to be measured before the rule is defended. Measured against the engine, with the default bands and an entity identical in everything else:
| Case | Operating balance | Overall rating |
|---|---|---|
| Current budget exactly in balance | 0.0000 | High |
| Surplus of one hundredth of a percentage point | +0.0001 | Low |
| No debt, no service and no contingent liabilities; current deficit of half a point | −0.0050 | High |
The first two are a two-band jump for one hundredth of a percentage point, because the knockout fires on the high band and the intermediate band only enters weighted: there is no gradient between "forced to high" and "averaged to low". The third calls high risk an entity with no debt and no contingent exposure for half a point of current deficit; without the knockout, its weighted average leaves it in the low band.
The first and the second are a problem of grading. The third is a different and worse problem: the operating balance knockout is a statement about the capacity to service debt, and an entity with no debt has no debt to service. Its current deficit is a management problem and a legitimate alert; it is not an insolvency.
The correction this method proposes, and which is a position the manual takes on its own tool:
All three are calibration changes, not engine changes. [to be built], and until they exist the manual teaches the rule with its defect on show, because that is the only honest way to teach a rule that is going to be corrected.
A threshold set cited under the name of a law only rewrites the cut-offs of the indicators its source regulates; the rest go on being rated against the default bands. The consequence for this step is direct and has to be anticipated here: the overall rating that comes out under the name of a foreign regime is built, for the most part, with cut-offs that are not that regime's. §5.2 measures it and §6 uses it. The method's rule: when publishing a rating obtained with a cited set, it is said which indicators that set governs and which it does not.
And a graver consequence of the same mechanism, measured and verified, which belongs in this step because it bears on the knockout: a threshold set can loosen the cut-off of a knockout indicator, and with it switch off the rule. The engine's cut-off for debt service is 0.075 / 0.10, and three of the seven published sets move it upwards: the Brazilian municipal one to 0.090 / 0.115, the Colombian one to 0.10 / 0.15, and the own calibration for high-income local governments to 0.08 / 0.12. Checked against the engine with an entity whose debt service absorbs 11 % of its total revenue and whose other five ratios come out in the low band under all seven sets — so that the only thing that can move the verdict is that cut-off:
| Set applied | Debt service | Does the knockout fire? | Weighted average | Overall rating |
|---|---|---|---|---|
| Engine default bands | 0.11 → High | yes | 1.480 | High |
| Debt ceiling, states (Brazil) | 0.11 → High | yes | 1.480 | High |
| Subnational rule (Peru) | 0.11 → High | yes | 1.480 | High |
| State anchors (India) | 0.11 → High | yes | 1.387 | High |
| Debt ceiling, municipalities (Brazil) | 0.11 → Medium | no | 1.240 | Low |
| Traffic light (Colombia) | 0.11 → Medium | no | 1.194 | Low |
| High-income local governments (Austral calibration) | 0.11 → Medium | no | 1.240 | Low |
Two bands, in the benign direction, and on the only indicator that can force the rating on its own. In all three cases the jump is not from one band to the adjacent one: it is from high to low, without passing through the intermediate one, because what changes is not the average but the existence of the rule. And in two of the three the set carries the name of a jurisdiction whose articles say nothing about debt service measured against total revenue: the cut-off does not come from the law cited, it comes from a calibration decision the label does not distinguish from the law.
The method's rule, in two halves. The first: the cut-off of a knockout indicator is not moved by a threshold set unless the rule itself sets it. The second, for as long as it is moved: every rating produced — or avoided — by a knockout is published with the threshold set that governed it and with the weighted average alongside. §4.5 shows the entity where both halves can be seen at once. [to be fixed]
In: the inventory of the commitments of the entity and of the perimeter layers from Step 0 — the register of guarantees granted, the statements of the corporations and enterprises, the year's liabilities report, and the status of the claims against it.
Out: the contingent liabilities sheet: the list of what can turn into cash, with its nature, its amount and its route to materialisation, grouped into four families that are not added to each other. And the sheet's total, which is the only number that enters indicator 6 of Step 3.
This is the step where the method parts from a debt register, and where the thesis of §1.7 becomes operational. The four families:
To its enterprises, to its corporations, to third parties. They are recorded at face value — the amount the entity would pay if the guarantee were called in full — and they are not valued here. Valuing the probability of being called and the expected cost is another discipline and another manual; this step publishes the stock and that one publishes the expected cost, and the consolidated register takes one of each. It is the rule that avoids double counting, and it is one of valuation, not of inventory.
What this step does require, and it is the part almost no subnational register has, is an inventory that is complete and frequently updated: for each guarantee, its nature, its face value, its maturity and the evolution of disbursements and amortisations of the guaranteed loan. The OECD paper asks for it in those words (§2.2), and there is one jurisdiction in the §2.6 table that has it built — a national register of credit and of the guarantees granted by territorial entities — which is exactly what this step needs and what almost nobody else publishes.
Two points about direction. The first: there are jurisdictions that prohibit the entity from guaranteeing — the regional regime in the Chilean row of §2.6 expressly provides that it may not secure or guarantee the commitments of the entities it funds — and in those cases the family is zero by rule, which is declared with the citation, not with a mute zero. The second: there are regimes that put a stock ceiling on the guarantees granted — the Brazilian one sets it at a percentage of receita corrente líquida, liftable under cumulative conditions — and that ceiling is a Step 2 gate even though its object is a contingent liability.
The deficit that ends up in the entity's budget. It is not a guarantee and there is no document that obliges it: it is the consequence of being the owner, or of being the level of government that answers for the service.
It is measured by the year's operating deficit, entity by entity across the perimeter, and by the accumulated accrued liability of each one. Both figures, not one: the year's deficit says how much it will cost to keep it going next year, and the accumulated liability says how much it would cost to put it right. A health corporation with a moderate annual deficit and five years of accumulated liability is a stock problem dressed up as a flow problem.
Where the layer is material and there are no statements — the case Step 0 requires to be named and estimated — it enters here with its labelled estimate. A material layer with no figure enters with an estimate; it does not enter with a zero.
They are not contingent: they are certain and they are late. They are recorded in this step for a practical reason — the inventory of what is not financial debt is drawn up in one pass — and they are labelled clearly, because their treatment is different: a contingent liability may not materialise, and this one already has.
They are measured against two denominators and both readings are published:
And the cross-check Step 3 anticipated, done here because this is where the datum is: if the current balance improved and accrued unpaid expenditure grew, the balance did not improve, it was shifted. The change in accrued unpaid expenditure is always published alongside the change in the current balance.
In jurisdictions that do not allow ordinary subnational borrowing, this family is the entity's dominant obligation and the main object of the diagnostic (§2.6, Step 2.4).
Court-ordered obligations, with their procedural stage and the amount claimed. They are recorded by amount, not by probability, and grouped by stage — claim served, first-instance judgment, final judgment — because the stage is the only grading of probability this method admits without a case-by-case legal analysis. A final judgment is not a contingent liability: it is a debt, and it moves to family 5.3.
(a) The four families are declared separately and not added to financial debt without a label. An aggregate total of "contingent liabilities" without a breakdown is the cleanest way to hide that three quarters of it is a single guarantee, or that half of it is accrued unpaid expenditure that is not contingent at all.
(b) The guarantee is recorded by its stock, not by its expected cost. And every time the stock is published it is said that it is not an expected loss, because most guarantees are never called and publishing face value as a loss is as misleading as omitting it.
(c) The sheet's total is what enters the indicator, and the sheet travels with the result. Indicator 6 of Step 3 is a ratio over a total; without the sheet behind it, that total is not auditable and the ratio means nothing.
[to be built]: the module has a single aggregate field for contingent liabilities, with no breakdown by family, and no field for accrued and unpaid obligations. Until it has them, the contingent liabilities sheet is kept outside the tool, its total is written into the one field there is, and the report should say what that total is made of — which today it does not.
In: the diagnostic of each entity of the portfolio, run with the same methodology, the same thresholds and the same language.
Out: four things, and the order in which they are read matters: the distribution by band, the order of the portfolio, the concentrations, and the correlation warning.
(a) Same methodology, same thresholds, same language for all of them, or the comparison means nothing. It is the obvious rule and the one most often broken in practice, because portfolios are built by accumulation: one entity was assessed last year with a different threshold set, another was assessed with the current-account split and a third without it. A portfolio assembled that way has an order that is not an order of risk. The operating rule: if an entity cannot be assessed on the same basis as the others, it is assessed anyway and flagged, and its position in the order carries the flag.
(b) Within a band the order is broken by severity, not by size. Two entities in the high band are ordered by their weighted average, which is the same quantity the Step 4 roll-up bands. The entity's size does not order the risk: it orders materiality, which is a different reading and is published separately. A small municipality in the high band is worse off than a large province in the medium band; the province costs more. Both sentences are true and both are needed.
(c) An entity that cannot be computed orders last, and never displaces a high-risk one. And it appears on the list, with its coverage, because an entity that could not be assessed is a supervision problem and not an entity without risk.
(d) The aggregate is read with its breakdown. A portfolio with comfortable average headroom and two entities in the red is not a comfortable portfolio: it is a portfolio with two problems and an average that covers them. The distribution by band — how many entities in each — goes before the average in any presentation, and the average goes with its dispersion and with the extremes named.
(e) The subnational risks of one country are correlated. They share the business cycle, the transfer formula and, often, the price of a commodity. The OECD paper says so for the risk families — many of the risks of its six sources are positively correlated, and those correlations must be incorporated into the assessment (§2.2) — and the firm's published work models it for a portfolio (Austral, Stress-Testing PPP Portfolios). The operational consequence: adding up the worst cases of N entities assumes perfect correlation, and it is published as an upper bound with that label. It is not a forecast and it is not an expected value: it is the ceiling of what the portfolio can cost if the shock reaches all of them at once, which is what usually happens.
The distribution by band says how many entities are in trouble. The concentrations say where the obligation is, which is not the same thing:
Where a ceiling exists — on the portfolio's debt stock, or on the annual flow of authorised operations — the portfolio reading stops being descriptive and becomes a decision about ordering. The Brazilian regime in the §2.6 table is the statutory version of the problem: the consolidated debt ceiling arrived with a glide path of fifteen financial years, with a minimum reduction per year, periodic measurement and a bar on contracting for as long as the irregularity lasts; and separately there is an annual ceiling on the amount of operations. They are two different constraints on the same entity, and running a portfolio under both is a problem of ordering and not of addition (Austral, The Pipeline Under the Ceiling).
The method's rule: where there is a ceiling, the order of the portfolio is published with the ceiling's consumption alongside — how much is left, how many operations fit, what the glide path is — because an order of risk without the ceiling does not tell the unit what to authorise.
[to be built]: the module orders the portfolio and knows nothing of ceilings. The surface that does have them is a different one, with a different entity model, and §5.5 explains why the manual does not teach it as part of the method. And two limits of the portfolio screen that bear directly on this step: it rates with five indicators and not six — it does not carry the liquidity fields, so the same entity can come out in the medium band in the individual assessment and in the low band in the comparison, with no warning — and it does not show the indicator values or the distribution by band, although the engine computes both. Today, the Step 6 portfolio reading is assembled by hand from N individual assessments.
In: the portfolio diagnostic from Step 6, the central level's register of guarantees, the central level's register of loans to subnational entities, and the year's transfer execution.
Out: the central-level exposure, by channel, without adding the channels up, and expressed once only as a percentage of a declared base.
It is the step a ministry of finance reads this manual for. It is also the step no screen in the platform runs: the module ends in a rating and does not produce a single monetary figure. It is taught all the same, and taught in full, because describing it in silence — as though the tool did it — is not an option.
Before the channels, the authorisation that makes this step reachable. The Fund's note says that quantifying the risk typically involves an estimate of probability-weighted exposure, but that in most cases it is enough to record the maximum exposure the central level has to its subnational governments; and it specifies what has to be measured: the debt and other financial liabilities the central level might be forced to assume, and any other unanticipated financial outflow if an entity's position deteriorates significantly (§2.1). Hence this method's position: no probability model is needed to start. What is needed is to publish the amounts that already exist, channel by channel and without adding them up.
| Channel | What is measured | Where it comes from |
|---|---|---|
| 1 · Subnational debt with an explicit central-level guarantee | The guaranteed stock, at face value, by entity | Central level's register of guarantees |
| 2 · Intergovernmental debt | On-lent funds and central-level loans receivable, with their arrears | Central level's credit register; the entity's statements |
| 3 · Discretionary transfers | What was actually transferred in the year outside the formula, by entity | Central level's budget execution |
| 4 · Implicit rescue | Nothing, as a figure. It is named and argued | The diagnostic itself |
Channel 1 — the explicit guarantee. It is the only one almost every register looks at, and it is the one that says least, for the same reason that makes it easy to look at: it is written down. It is recorded at face value, separated by entity, and declared not to be an expected loss. Valuing it belongs to another manual.
Channel 2 — intergovernmental debt. The central level that lent to an entity has an asset, and that asset is worth what the entity can pay. The receivable balance is recorded, and separately the part in arrears, because arrears on a central-level loan are a signal of materialisation and open a case outside the calendar (Step 9). This channel is the one most often omitted, because the loan appears as an asset in the central level's accounts and nobody reads it as exposure.
Channel 3 — discretionary transfers. It is the route by which the rescue happens every year without being called a rescue, and it is the channel to look at in order to detect recurrent support. The Fund's note is explicit that earmarked transfers tied to priority programmes rise when the entity has no resources to fund its share (§2.1). It is measured as what was transferred outside the formula — the rest is an entitlement of the entity, not support — and it is published as a series, not as the year's figure: an entity that received an extraordinary transfer three years running does not have a cyclical problem, it has a structural gap funded out of a line called extraordinary. This is the most useful reading of the step and the one no debt register contains.
Channel 4 — the implicit rescue. It is named, argued from the diagnostic itself — a large entity, in the high band, with essential services in its charge and no financing alternative has a probability of rescue nobody wrote down — and published without a figure, unless there is a basis for estimating it. The rule comes from the two principal sources, which write it from different sides: the Fund's note warns that explicitly identifying the entities likely to claim resources, or assigning them probabilities in a public document, is probably counterproductive because it creates moral hazard through the expectation of rescue, and that the provision can be made under an aggregate contingency line; the OECD paper says that large subnational governments may need to avoid publishing quantitative estimates of the probability and cost of individual risks, expressly naming implicit guarantees, where their disclosure would create significant moral hazard (§2.1, §2.2).
The exception, which both sources write: a rescue programme already agreed or approved goes in explicitly, as a separate line, for transparency and monitoring. A rescue that has been decided is not a contingent liability.
(a) The four channels are declared separately and not added up. They measure different things in different units: channel 1 is a conditional stock, 2 a deteriorable asset, 3 a flow already out of the door and 4 is not a figure. A single total of "subnational exposure" adding up the first three is a figure that means nothing and that will be quoted.
(b) The implicit channel is never added to the explicit ones. Not in a note, and not in a "total including an estimate for rescue". The moment it is added is the moment a probability of rescue is published.
(c) The base of the percentage is declared once and centrally. The channels are expressed in the year's currency; the portfolio total is also expressed as a percentage of one base — central-level revenue, budget, or output — and that base is written alongside the percentage every time it appears. Three percentages on three different bases in the same document is the commonest presentation error in this field.
And a presentation rule this step inherits from the Fund's note: the exposure is measured under each risk category, with a split between short- and long-term obligations, because the immediate potential outflows are the ones that deserve budgetary consideration this year.
This step has a product that is not a figure, and it is the reason the manual puts it before Step 8. The central level does in fact retain the subnational risk it transferred to nobody — channel 4 — and it retains it without having decided it and without having put it in a budget. Writing out the four channels forces one to look that retention in the face: how much of it is a policy decision — a regime that deliberately guarantees in order to make municipal credit cheaper — and how much is an inheritance nobody reviewed. The first is managed; the second is only paid. (Austral, The Optimal Risk-Retention Frontier; The Recognition Rule; The Useful Silence.)
[to be built]: the module does not run this step at all. There is no central-level exposure, no realised fiscal cost, no percentage of an external base; the only monetary figure that goes in — contingent liabilities — comes out converted into a ratio and never appears as an amount again. Until one exists, the four channels are built in a spreadsheet out of registers that live outside the module, and §5 says exactly what the analyst does in the meantime.
In: the result of Steps 3 to 7.
Out: the map of who each number is useful to, and the figures actually delivered to each destination in the format that destination uses.
Four destinations. The step's general rule: a figure with no destination is not published, and a destination that receives a figure without its base and its date is going to use it wrongly.
Receives the result of the Step 2 gate, computed on the legal denominator and on audited figures, with its legal consequence. It does not receive the overall rating, and this matters: a screening rating does not authorise or deny a credit operation, and using it for that is exactly the error §6.7 denounces. The overall rating accompanies it as context and is labelled as a screen.
Where the operation being authorised is a subnational public-private partnership project, this destination also receives the full diagnostic: the multi-year commitment the project creates is added to the entity's burden, and the gate's question is the one for the year of greatest commitment, not the year of signature.
Receives the subnational portfolio as one family of the consolidated register. The Fund's note lists the four contents that statement must carry on this subject, and they are exactly the products of the preceding steps (§2.1): the aggregate fiscal performance of the subnational sector with its key indicators (Step 6); the entity-level financial analysis, focused on identifying those in difficulty or close to it, with the rest aggregated (Steps 3 and 4); the relations with the central level in terms of transfers, debt owed, arrears and outstanding guarantees (Step 7); and the main risks identified with their mitigation measures and a discussion of the supervisory regime (Step 9).
Since the automatic hand-off does not exist, this manual has to teach how to write the row by hand, and say that it should not be necessary. The consolidated register's row carries, for the subnational family:
| Field of the row | What is written | Where it comes from |
|---|---|---|
| Entity | The entity's name, or "subnational portfolio" for the aggregate row | Step 0 |
| Family | Subnational governments | — |
| Description | What obligation it is, in one line, with the channel | Step 7 |
| Gross exposure | The central level's exposure to the entity, by channel, in separate rows | Step 7 |
| Expected cost | Only if a valuation exists; for guarantees, the one from the instrument's manual | Another manual |
| Stressed cost | Only if there is a scenario. And never without declaring the law that computed it | — |
| Tail law | The name of the rule that produced the stressed cost: deterministic scenario, maximum-loss percentile, conditional value at risk, full call on the stock | — |
| Realised cost | The year's discretionary transfers and the guarantees actually paid | Step 7, channel 3 |
| Probability | The entity's overall rating, raised if a knockout is live | Step 4 |
| Provisioned | Whether the central level has an appropriation set aside, or whether it is only disclosed | Budget |
| Mitigation | Performance plan in force, live ceiling, authorisation condition | Step 2, Step 9 |
| Date and currency | The close of the entity's accounts and the register's currency | Step 1 |
Two rules about that row, which are not matters of form:
[to be built]: the subnational family exists in the consolidated register's taxonomy, appears in the published document and has nobody to feed it: there is no hand-off from the diagnostic module. Today it is only filled in by hand, with the fields above, and it is mechanical work that a one-line function would spare.
Receives three very concrete things, which are the ones its subnational monitoring dimension asks for: the coverage — what fraction of the subnational sector is actually assessed; the publication lag — how long the register takes from the close of the accounts; and the existence of a consolidated report on the sector. None of the three is a risk figure; all three are figures about the register. The fiscal transparency code cited in §2.1 grades this subject at three levels — annual, annual plus a borrowing limit, and quarterly — and the scale is the yardstick with which this destination reads what it receives.
Receives the exposure by channel from Step 7 and, with it, the two decisions the budget has to take: how much to provision in the contingency line, and how much transfer to size. The disclosure rule of channel 4 applies here too, and the Fund's note writes it from this side: the provision can be made under an aggregate contingency line, without identifying the entities likely to claim.
In: the previous year's register, the year's accounts, the year's events and the changes of legal regime or of thresholds.
Out: the year's register, with the difference explained by cause; the list of alerts that fired; and the calendar for the next update.
A register that changes without saying why is not auditable. Each year, the difference from the previous one is decomposed into four causes, and all four are published separately:
The distinction is not an accounting one, it is one of interpretation: a portfolio that got worse through cause 4 got worse; a portfolio that got worse through cause 3 did not change, it was measured differently. And the hard rule: a change of legal regime invalidates the year-on-year comparison unless both years are recomputed on the same basis. The case is live and recent: one of the regimes in the §2.4 table moved its debt ceiling in 2021, and any series crossing that year with the old ceiling on one side and the new one on the other is comparing two different things.
Every published figure carries, without exception:
[to be built]: the module does not persist versions of the subnational register. Each run is independent and there is nowhere to keep the previous one for comparison; the series is assembled outside. And the report the tool produces carries no generation date, does not carry the inputs that produced it and does not carry the scope warning the screen itself has written on it — so that today the deliverable a government takes to its council is not reproducible by whoever receives it. §5 describes this screen by screen.
Five, and none of them waits for the annual cycle:
All five are signals of materialisation: when they occur, the risk is no longer a risk, and the register stops being an instrument of surveillance and becomes the file of a case.
The method needs an owner, and the two principal sources say which. The Fund's note recommends a dedicated unit inside the ministry of finance, responsible for subnational risk analysis, for feeding the fiscal risk statement and for contributing to the debt management strategy. The OECD paper adds the condition experience makes obligatory: the framework requires adequate governance arrangements, because the necessary information is usually dispersed across units that do not share it in time, and the power to take on certain risks — guarantees, first of all — is usually fragmented within the organisation itself (§2.2). A register with no focal point degrades in two financial years, and the degradation is invisible: the figures keep coming out.
And the warning the Fund's note writes and this method repeats in Step 1: the analysis will be only as good and as reliable as the data that feed it, and obtaining those data is usually the main problem. Part of the unit's work is not analytical: it is getting forty entities to report on the same basis and on time.
| Step | In | Out | Is there a screen? |
|---|---|---|---|
| 0 Perimeter | Organisation chart and linked entities | Written perimeter with its list of exclusions | No |
| 1 Accounts and quality | Budgetary and financial statements | Twelve inputs with their basis, and the gap sheet | Yes, with no identity validation |
| 2 Statutory gate | Jurisdiction and Step 1 figures | Legal situation with its legal denominator | Only if the threshold set introduces it |
| 3 Six indicators | Step 1 inputs | Six ratios with band, direction and weight; coverage | Yes |
| 4 Roll-up | Step 3 bands and Step 2 gate | Overall rating with its reason and its coverage | Yes |
| 5 Contingent liabilities | Inventory of commitments | Contingent liabilities sheet, four families unadded | A single aggregate field |
| 6 Portfolio | Diagnostic of each entity | Distribution, order, concentrations, upper bound | Yes, with five indicators out of six |
| 7 Bridge to the central level | Portfolio and central-level registers | Exposure by channel, unadded, with its base | No |
| 8 Destinations | Result of Steps 3 to 7 | Gate, register row, coverage, provision | No automatic hand-off |
| 9 Governance | Previous register and events | The year's register with the difference by cause | No persisted versions |
Thirteen questions. A subnational register that cannot answer them is not necessarily badly made, but it is not auditable — and the difference matters on the day somebody asks.
This section walks the method of §3 — from the perimeter to the consolidated register — over a complete portfolio, with the opening figures on show, the result of each step and the reading a subnational debt unit would make of it. The portfolio is fictitious: the Republic of Lemuria does not exist, and neither do its four subnational governments. It is, deliberately, the same portfolio that comes seeded in the platform's demonstration workspace, so that any reader can open the screens of §5 and find exactly the numbers on these pages. Annex 4.A says how to do it and what cannot be done yet.
Four reading warnings, before the first figure.
No figure in this section is written by hand. All of them — the six ratios of each entity, the seven runs with different threshold sets, the sensitivity table, the four exposure channels — come out of a run of the engine on this portfolio, and they are replaced by running it again. It is the discipline of the series and it is not cosmetic: when the example is the proof that the method works, the example has to be an output and not a transcription. Where a figure does not come from the engine but from arithmetic on a declared assumption — the whole of Step 7, the breakdown of the Step 5 families, and the bases of the percentages — the text says so on the spot.
The diagnostic figures and the exposure figures are of two different kinds and are never added together. The diagnostic delivers bands — Low, Medium, High — and a portfolio order; Step 7 delivers amounts. Within the amounts there are in turn two kinds that are not added to each other either: a stock of explicit exposure (2,105) and a flow of fiscal cost realised in the year (435). And there is a fourth channel — the implicit rescue — which is named, argued and published without a figure. A report that adds 2,105 and 435 is badly written, and a report that adds an estimate of the implicit rescue to them is worse.
The currency, the country, the year, the output and the central level's revenue are declared assumptions. The figures are in millions of Lemuria's currency, they correspond to the 2025 financial year, Lemuria's output is 60,000 and central government revenue is 13,200 (22 % of output). None of those four numbers is derived from anything: they are values the analyst types in, and that is why every figure in "% of output" or in "% of central-level revenue" carries its base alongside. When readers apply the method to their own country they will change those bases and all the percentages will change; no decision of the method depends on them.
And the limitation this example cannot overcome, said at the beginning and not at the end: the portfolio is of a single period. The diagnostic that follows is a snapshot of the 2025 financial year. Subnational solvency is a trajectory — a current balance that narrows three years running says more than its level in one; a stock of accrued and unpaid obligations that grows says more than its ratio over revenue; a bunched maturity profile is not visible in the year's debt service — and none of that is illustrated here because the tool takes one period and not a series. §3 teaches the trend reading all the same, because it is method and not tool; §5 declares the absence; and this example says, every time it rests on a one-year figure, what it lacks to be a complete solvency reading.
Lemuria is a country with three levels of subnational government — states, provinces and municipalities — and a central register of 42 entities supervised by its subnational debt unit. The example takes four of them, chosen to cover the full spectrum of the screen and, in the fourth case, to expose the consolidation mechanics the other three cannot show. It is not a sample: it is a walk through the readings the method produces.
| Entity | What it is | Why it is in the example |
|---|---|---|
| Aurora | Large state, with an own tax base | The healthy case, against which everything else is read |
| Puerto Verde | Provincial capital, dependent on transfers | The interesting case: it is the entity whose verdict changes with the rule book |
| San Miguel | Municipality in difficulty | The grave case, and the one that teaches that the most consequential legal test can fall silent exactly there |
| Cordillera | Province with a mixed profile: two bad debt ratios and four clean ones | The commonest case in practice, and the only one where the roll-up rule can be seen working: simple average Low, weighted average Medium, published rating High |
The fourth entry is recent and it is worth saying why it exists. The first three entities have all six indicators in the same band each — Aurora Low six times, Puerto Verde Medium six times, San Miguel High six times — and with that profile the severity-weighted average and a simple average always coincide: the weights cannot be seen working and the knockout never has a different weighted verdict to override. Cordillera exists so that both mechanics are on show on an entity of the pack and not on a case loaded by hand (§4.5).
Table 4.1 — The twelve Step 1 inputs, 2025 financial year, in millions
| Input | Aurora | Puerto Verde | San Miguel | Cordillera |
|---|---|---|---|---|
| Total revenue | 4,200 | 1,850 | 620 | 2,600 |
| Own revenue | 3,050 | 830 | 150 | 1,820 |
| Intergovernmental transfers | 1,150 | 1,020 | 470 | 780 |
| Operating expenditure | 3,600 | 1,700 | 690 | 2,350 |
| Current revenue | 3,900 | 1,720 | 590 | 2,500 |
| Current expenditure | 3,500 | 1,660 | 640 | 2,270 |
| Debt outstanding | 1,700 | 1,300 | 780 | 3,000 |
| Debt service (principal + interest) | 260 | 155 | 80 | 300 |
| of which, interest | 150 | 85 | 52 | 170 |
| Liquid assets | 640 | 180 | 25 | 380 |
| Short-term obligations | 380 | 150 | 60 | 200 |
| Contingent liabilities | 590 | 480 | 360 | 310 |
Two rows go in italics and outside the aggregate that contains them, and it is not a presentational preference. Transfers are not own revenue, and §4.2 measures what happens when somebody adds them upwards. Interest is not debt service: it is its non-discretionary component, and it is the numerator of two of the statutory gates of §4.3, where amortisation — a capital item — does not enter.
Table 4.2 — The four derived quantities the method needs and that are not fields of the tool
| Derived quantity | Aurora | Puerto Verde | San Miguel | Cordillera |
|---|---|---|---|---|
| Ahorro operacional (current rev. − current exp.) | 400 | 60 | −50 | 230 |
| Amortisation (service − interest) | 110 | 70 | 28 | 130 |
| Overall balance (total rev. − operating exp.) | 600 | 150 | −70 | 250 |
| Own revenue + transfers (identity against the total) | 4,200 | 1,850 | 620 | 2,600 |
The first row is the one that decides §4.3 and it is worth reading before any ratio: Aurora has 400 of current surplus to service 150 of interest; Puerto Verde has 60 to service 85; San Miguel has minus fifty; and Cordillera has 230 to service 170, which is the only entity in the portfolio whose current headroom looks comfortable in the diagnostic and is not, in the eyes of the law. The diagnostic's debt ratios do not say that, and it is the first thing a legal regime looks at.
The last row is the Step 1 identity check: in all four entities own revenue plus transfers ties exactly with total revenue. That is what should happen and here it happens; §4.2 shows what occurs when it does not, and §6.3 measures the cost of not checking it.
Table 4.3 — The declared assumptions of the exercise, in one place
| Assumption | Value | Where it comes from |
|---|---|---|
| Country | Republic of Lemuria (fictitious) | the example's convention, the same as the series' state-owned enterprise manual |
| Currency and unit | millions of Lemuria's currency | the example's convention |
| Financial year of the accounts | 2025 | the example's convention |
| Lemuria's output | 60,000 | typed in by the analyst |
| Central government revenue | 13,200 (22 % of output) | typed in by the analyst |
| Entities in the full subnational register | 42 | the year's perimeter (Step 0) |
| Entities in this example | 4 | the module's complete demonstration pack |
| Periods per entity | 1 | tool limit, declared |
| Reference threshold set | the published indicative one of §2.3 | the engine's default set |
| Threshold sets of the contrast | the six remaining ones in the library | the module's published library |
None of these values is a truth; all of them are choices, and the method requires publishing them alongside the result. The last four are the ones that move the verdict most, and §4.4 measures by how much.
Step 0 asks for the written definition of what is being measured, with its list of exclusions, before measuring and published with the result. In Lemuria the four definitions are different, and that asymmetry is information:
| Entity | What goes in | What stays out, and how it is treated |
|---|---|---|
| Aurora | Central administration of the state and its direct services | Its state water company, of material size, stays out and is named: it is an object of the series' state-owned enterprise manual, not of this one. Its state-guaranteed debt enters here as a guarantee granted (§4.6) |
| Puerto Verde | Municipal administration, plus its transport corporation consolidated | Two cultural foundations, not consolidated, are named and estimated by order of magnitude; their combined deficit is less than 1 % of the entity's current expenditure |
| San Miguel | Municipal administration | Its transferred health and education services, which in this jurisdiction have separate accounts, stay out and are named. It is the gravest of the four exclusions, and the text below says why |
| Cordillera | Provincial administration and its direct services | Nothing material outside the perimeter. It is the only one of the four whose definition has no exclusions, and that is information: its high debt burden is all its own and there is nowhere to hide more |
San Miguel's exclusion is the one a reviewer should attack first, and the manual leaves it on show instead of hiding it. A municipality in difficulty whose deficit lives in its transferred services presents a relatively orderly central administration and an insolvent group. That is not the case here — San Miguel's central administration is already in current deficit on its own — but nothing in the tool's result would allow "there is no risk there" to be told apart from "we did not look", and that is why the perimeter is published in words. The tool has no perimeter block: the analyst writes it outside and attaches it.
Step 1 requires the current account to be separated from the capital account, and the reason is that the balance that matters for solvency is the current one. When the entity supplies the split, the engine computes the operating balance proper: current revenue less current expenditure, over current revenue. When it does not, it falls back to a gross operating margin over total revenue and labels it as such in its note, which is the right way to do it. They are not the same measure, and the difference is material:
Table 4.4 — The same entity, two balances, depending on whether the split is supplied
| Entity | Operating balance (with split) | Band | Gross operating margin (without split) | Band | Difference |
|---|---|---|---|---|---|
| Aurora | +0.1026 | Low | +0.1429 | Low | +4.03 pp |
| Puerto Verde | +0.0349 | Medium | +0.0811 | Low | +4.62 pp |
| San Miguel | −0.0847 | High | −0.1129 | High | −2.82 pp |
| Cordillera | +0.0920 | Low | +0.0962 | Low | +0.42 pp |
Four readings. First: the gross margin is systematically more favourable in the three entities with a surplus, because it includes in the numerator capital revenue that does not fund operations. Second: in Puerto Verde the difference changes the indicator's band — from Medium to Low — on the indicator that is a solvency knockout. Third, and this is what saves the situation: the overall rating of all four does not move, because the rest of Puerto Verde's profile holds it at Medium and Cordillera is condemned by a different knockout. That is, the defect is not visible in the headline and is visible in the ratio the council is going to argue about.
And the fourth, which is about method and not product: the size of the gap between the two measures is itself a datum about the entity. In Cordillera the difference is 0.42 points and in Puerto Verde 4.62 — eleven times more — and that says that Puerto Verde's capital account is, proportionally, much larger than Cordillera's. A wide gap between the current balance and the gross margin warns that there is an investment cycle behind it that the current indicator is not seeing.
The method's rule is therefore about publication and not about formula: it is declared which of the two measures was published, and a portfolio where some entities supplied the split and others did not is not comparable on that indicator even if the column says the same thing for all of them.
The tool validates that each field is non-negative, and nothing more. Three consequences, measured on cases built for the purpose:
The identity nobody checks. An entity loaded with own revenue of 1,500 and total revenue of 1,000 returns a revenue autonomy of 1.5000, rated Low — that is, excellent — an overall rating of Low and zero flags. The identity own revenue + transfers against the total fails by 800 and not a word is said. §6.3 returns to this; here the methodological finding is enough: a ratio greater than 1 on an indicator that is a share is not an extreme value, it is an impossible datum, and the difference between those two things is precisely what an input validation exists to say.
Half a split is worse than none. An entity that supplies current expenditure without current revenue leaves the operating balance not computable, with an incomplete-assessment flag and a coverage of 5 of 6 indicators, when the other two fields it did bring would allow the gross margin to be computed. With the second leg supplied, the balance comes out at +0.0500, band Medium, coverage 6 of 6 and zero flags. The overall rating is Low in both cases, but the first publishes an incomplete diagnostic for want of a datum that was available.
Transfers in the wrong numerator. This is the single-cell error: the own revenue line adds own revenue and the transfer together, because in the budget statement they come one below the other. Measured over the four entities:
Table 4.5 — What happens if transfers go in as own revenue
| Entity | Correct autonomy | Band | Autonomy with the error | Band | Indicators in High | Flags | Overall rating |
|---|---|---|---|---|---|---|---|
| Aurora | 0.7262 | Low | 1.0000 | Low | 0 → 0 | 0 → 0 | Low → Low |
| Puerto Verde | 0.4486 | Medium | 1.0000 | Low | 0 → 0 | 0 → 0 | Medium → Medium |
| San Miguel | 0.2419 | High | 1.0000 | Low | 6 → 5 | 6 → 5 | High → High |
| Cordillera | 0.7000 | Low | 1.0000 | Low | 2 → 2 | 2 → 2 | High → High |
The result has to be read slowly, because it is more interesting than the simple version of the argument. The error changes no overall rating: revenue autonomy is the lowest-weighted indicator in the set, and the other five ratios hold up the verdict. What the error does is switch off exactly the signal that should have switched on. San Miguel, a municipality that funds 76 % of its budget out of transfers, comes to declare perfect autonomy, loses one of its six indicators in the high band and loses the corresponding flag. And the direction of the error is always the same: an entity wholly dependent on transfers can never come out badly on autonomy if transfers count as own revenue. That all four entities give exactly 1.0000 is the fingerprint of the error, because in all four the identity ties: the error turns an informative indicator into a constant.
Note also, and §5 declares it as a product limit, that the transfers field enters no calculation of the engine: setting transfers to zero leaves the result of all four entities identical, indicator by indicator. Transfer dependence is measured by its complement. It is not a calculation error, but it is a datum asked of the user that changes nothing — and it is the datum Step 7 is going to need.
The correction the method proposes is not to warn about the formula: it is not to give the opportunity to write it wrongly. The separation goes in the input form — own revenue and transfers are two different fields that are never in the same cell — plus the identity check as a soft input alert. The first the tool already does; the second, not yet.
This is the hinge step of the manual and the one that separates the method from a credit analysis. Before an indicator speaks, the law speaks: can this entity borrow? The answer to that question is not a rating, it is a legal situation, and it is published in that vocabulary.
The example applies the best-implemented regime in the module's library — the gate of interest over ahorro operacional of the Colombian law, which the engine computes on its legal denominator and not on a substitute — to the four entities of Lemuria. It is a declared transposition exercise: Lemuria is not Colombia, and what is being measured is what that test would say if that regime applied here. It is exactly what a central unit does when it wants to know how its portfolio would look under a regime it is thinking of adopting.
Table 4.6 — The gate of interest over ahorro operacional
| Entity | Ahorro operacional | Interest | Interest / saving | Band | Legal situation |
|---|---|---|---|---|---|
| Aurora | 400 | 150 | 37.5 % | Low | Presumption of capacity to pay. No authorisations required beyond those of the laws in force |
| Puerto Verde | 60 | 85 | 141.7 % | High | Prohibition. It may not contract new public credit operations, save under the conditions of the parágrafos of the article that establishes it |
| San Miguel | −50 | 52 | — | N/A | Not computable. The test falls silent |
| Cordillera | 230 | 170 | 73.9 % | High | Prohibition. Same consequence as Puerto Verde, with a current surplus the diagnostic rates Low |
The four rows teach four different things and all four are the method.
Aurora passes with room, and the number matters more than the band. 37.5 % against a cut-off of 40 % is not room: it is 2.5 points of margin above the threshold that separates the presumption of capacity to pay from the band where authorisation is needed. An increase in interest from 150 to 160 — or a fall in ahorro operacional from 400 to 375, which is 6 % — takes it out of the presumption. The diagnostic says Low; the gate says "green, and only just". They are two pieces of information and the manual publishes both.
Puerto Verde is the central case of the example. Its thin current balance — 60 of ahorro operacional on 1,720 of current revenue — leaves the interest ratio at 141.7 %, more than twice the prohibition threshold. And its diagnostic, under the same threshold set, has debt service in the Low band (0.0838 against a cut-off of 0.10) and debt burden at Medium. That is: the same entity, on the same day, with the same accounts, is a legal red light and an intermediate diagnostic profile. There is no error in either figure. They measure different things: an annual cash flow ratio against total revenue, and an interest ratio against a current surplus defined by law. §6.7 measures what confusing them costs.
Cordillera is the case that separates the gate from the diagnostic more cleanly than any other. Its operating balance is +9.2 %, band Low: on the diagnostic indicator it is the entity with the most comfortable current surplus after Aurora. And the legal gate, on that same surplus, leaves it at 73.9 % — well above the 60 % prohibition — because its interest is large: 170 on a stock of 3,000. The lesson is that a current balance that is healthy relative to its own revenue can be insufficient relative to the debt it has to service, and that those are two questions and not one. The diagnostic asks whether the entity operates in balance; the gate asks whether what is left over is enough for the interest. An entity can answer yes to the first and no to the second, and Cordillera is exactly that entity.
And San Miguel is the case that organises the manual's criticism of its own tool. San Miguel has negative ahorro operacional: there is no current surplus out of which to service interest. Under the logic of the law that creates the gate — whose definition of capacity to pay is "the minimum flow of ahorro operacional that allows debt service to be met in full in every year, leaving a remainder to finance investment" — that is not an absence of information: it is the worst possible result of the test. The engine returns not computable and excludes the gate from the roll-up. The entity in the worst shape is the only one of the four to which the most consequential legal test says nothing.
San Miguel comes out High anyway, because of the other two knockouts, and there lies the trap: it is correctly classified for the wrong reason. An entity with negative ahorro operacional, positive interest and no current-account split supplied would trigger neither of the two signals, and would come out of the tool with nothing to indicate that the legal test applying to it could not be run. The method's rule, which §3 Step 2 writes and the tool does not yet implement: a non-positive denominator with a positive numerator is High with a note, not N/A.
The Colombian set in the library applies, besides the interest gate, a debt burden cut-off. Until the correction this edition records, that cut-off was 0.60 / 0.80 and its source text cited "debt outstanding ≤ 80 % of current revenue" — a ceiling that ceased to be in force in 2021, when the article that sets it took it to 100 % (§2.4). The set today publishes 0.80 / 1.00: the 1.00 is the statutory ceiling in force and the 0.80 is an early warning calibrated by this firm, declared as such and deliberately placed at the old legal ceiling. The exercise of measuring what the superseded cut-off was costing has been done, and it is published because the result is counter-intuitive:
Table 4.7 — The superseded cut-off against the one in force
| Entity | Debt burden | Band with 0.60 / 0.80 (superseded) | Band with 0.80 / 1.00 (in force) | Overall (superseded) | Overall (in force) |
|---|---|---|---|---|---|
| Aurora | 0.4048 | Low | Low | Low | Low |
| Puerto Verde | 0.7027 | Medium | Low | High | High |
| San Miguel | 1.2581 | High | High | High | High |
| Cordillera | 1.1538 | High | High | High | High |
One entity changes band on that indicator and none changes overall rating, because Puerto Verde's verdict is produced by the interest gate and not by debt burden, and San Miguel's and Cordillera's are on the same side of both cut-offs. That did not make the defect irrelevant, and it is worth saying precisely why, because it is the general lesson of the subsection: it separates two things that get confused. The magnitude of the error in the published result, which here was nil. And the attribution problem, which was total. A threshold set carrying the name of a law, marked in the product as a direct statutory figure, publishing a cut-off that the law superseded, is an audit problem even if it moves not a single band — and it is a problem that is only discovered by reading the law, never by reading the result. The manual cited the law; the product corrected the cut-off.
The module publishes seven cited threshold sets. Four of them are statutory regimes of different countries, and applying them to the same portfolio is the experiment that turns this example into a lesson in method:
Table 4.8 — The same portfolio, six rule books
| Threshold set | Aurora | Puerto Verde | San Miguel | Cordillera |
|---|---|---|---|---|
| Default indicative bands | Low | Medium | High | High |
| Gate of interest over ahorro operacional (Colombian regime) | Low | High | High, with the gate at N/A | High |
| Interest-over-current-revenue anchor (Indian regime) | Low | Medium | High | High |
| Debt-to-revenue ceiling, municipalities (Brazilian regime) | Low | Low | High | High |
| Debt over average current revenue rule (Peruvian regime) | Low | Medium | High | High |
| Own calibration for high-income local governments | Low | Medium | High | Low |
Two entities move and neither of the two is the one the reader would expect. Puerto Verde goes from Medium to High under the Colombian regime for the reason in the previous subsection. And Cordillera goes from High to Low under the own calibration for high-income local governments — the only set in the library that does not cite a foreign jurisdiction, because it belongs to this firm and is marked as such — and it does so through a mechanism worth looking at closely: that calibration moves the debt service cut-off from 0.075 / 0.10 to 0.08 / 0.12, and Cordillera's 0.1154, which under the engine's bands is the high band and a knockout, is left under it in the medium band and stops firing. Without the knockout, the weighted average of 1.800 does not hold either — the two cut-offs the calibration moves are precisely the two Cordillera has badly — and the entity comes out Low. It is the most expensive case in the library and it has its own subsection in §4.5. Under the Indian anchor it passes, and with room. The two interest gates have the same numerator — interest alone, without amortisation — and different legal denominators, and that is enough to invert the verdict:
| Entity | Interest | Over ahorro operacional | Consequence | Over current revenue | Consequence |
|---|---|---|---|---|---|
| Aurora | 150 | 37.5 % | green, by 2.5 points | 3.85 % | keeps the additional headroom |
| Puerto Verde | 85 | 141.7 % | prohibition | 4.94 % | keeps the additional headroom |
| San Miguel | 52 | — (saving −50) | not computable | 8.81 % | keeps the additional headroom |
| Cordillera | 170 | 73.9 % | prohibition | 6.80 % | keeps the additional headroom |
The four rows on the right are the lesson: all four entities pass the Indian anchor, including the insolvent municipality and the province the other regime prohibits from borrowing. San Miguel reaches 8.81 %, band Medium, below the 10 % — and not because its situation is good, but because its interest is small precisely for the same reason that makes it insolvent: it has little financial debt because nobody lends to it. Cordillera reaches 6.80 %, band Low, with 3,000 of financial debt and a legal prohibition on it under the other regime: the anchor that absolves it measures its interest against a large current revenue, and the gate that condemns it measures the same interest against what is left over from that revenue. A gate over current revenue measures the burden of the debt; a gate over the current surplus measures the capacity to pay it. The second is the one that detects this entity and the first can never detect it. Two legal regimes, two opposite answers about the same entity on the same day, and both correct in their own jurisdiction — which is exactly why the manual requires naming the gate that was applied and not only its result.
And under the Brazilian municipal ceiling Puerto Verde falls to Low, which teaches the other side and is a criticism of the product and not of the method. That set rewrites two cut-offs out of six — debt burden and debt service — which are precisely the two where Puerto Verde improves; the other four go on being rated against the indicative bands, which are not Brazilian. The result is published with the foreign law's label on top and no surface says which indicators the set governs and which it does not. The reading rule the manual imposes: a country threshold set governs only the indicators its source regulates, and an overall rating under a country label is a hybrid that has to be declared.
How much each set governs, measured one by one. It is the datum no screen publishes and without which the previous rule cannot be applied:
Table 4.8b — What each set in the library rewrites
| Set | Confidence mark | Cut-offs it rewrites, out of the six | Gates it introduces |
|---|---|---|---|
| Indicative screen (the default set, exposed as a set) | direct | 0 | — |
| Debt ceiling, states (Brazil) | adapted | 1 · debt burden | — |
| Debt ceiling, municipalities (Brazil) | adapted | 2 · debt burden, debt service | — |
| Traffic light (Colombia) | direct | 2 · debt burden, debt service | interest / ahorro operacional |
| Subnational rule (Peru) | adapted | 1 · debt burden | — |
| High-income local governments (Austral calibration) | own | 2 · debt burden, debt service | — |
| State fiscal responsibility anchors (India) | direct | 0 | interest / current revenue |
Two things about this table. The first: no set governs more than two of the six indicators, and two of them govern none. A result labelled with the name of a jurisdiction has, at best, four of its six ratios rated against this firm's bands. The second: the penultimate row carries no country name and no agency name, and its confidence mark is neither "direct" nor "adapted" but its own. It is an Austral calibration for high-income local governments, with its reasoning written into the source field instead of an external citation, and that honesty of labelling is what makes it possible to read Cordillera's result from the previous subsection without mistaking it for a legal mandate from anywhere.
Table 4.9 — The full diagnostic on the default indicative bands
| Indicator | Dir. | Medium cut-off | High cut-off | Weight | Knockout | Aurora | Puerto Verde | San Miguel | Cordillera |
|---|---|---|---|---|---|---|---|---|---|
| Revenue autonomy | lower is worse | 0.60 | 0.30 | 1.0 | — | 0.7262 Low | 0.4486 Med | 0.2419 High | 0.7000 Low |
| Debt burden | higher is worse | 0.50 | 1.00 | 2.0 | — | 0.4048 Low | 0.7027 Med | 1.2581 High | 1.1538 High |
| Debt service | higher is worse | 0.075 | 0.10 | 3.0 | yes | 0.0619 Low | 0.0838 Med | 0.1290 High | 0.1154 High |
| Operating balance | lower is worse | 0.05 | 0.00 | 3.0 | yes | +0.1026 Low | +0.0349 Med | −0.0847 High | +0.0920 Low |
| Liquidity | lower is worse | 1.50 | 1.00 | 2.0 | — | 1.6842 Low | 1.2000 Med | 0.4167 High | 1.9000 Low |
| Contingent liabilities | higher is worse | 0.20 | 0.50 | 1.5 | — | 0.1405 Low | 0.2595 Med | 0.5806 High | 0.1192 Low |
| Overall rating | Low | Medium | High | High | |||||
| Coverage | 6 of 6 | 6 of 6 | 6 of 6 | 6 of 6 | |||||
| Flags | 0 | 0 | 6 | 2 |
The first three columns have a regularity that belongs to the demo portfolio and not to the method, and it has to be said before the reader takes it for a property of the world: Aurora, Puerto Verde and San Miguel come out in the same band on all six indicators — Low six times, Medium six times, High six times. It is a portfolio built to teach, and that cleanness had a concrete pedagogical cost: it could not illustrate the commonest case in practice, which is the entity with four clean ratios and two bad ones, where the Step 4 roll-up rule is the only thing that decides.
The fourth column is that case and it is on show. Cordillera has four ratios in the low band — autonomy, operating balance, liquidity and contingent liabilities — and two in the high band: debt burden and debt service, which are the two highest-weighted indicators in the set after the operating balance. Two flags out of six indicators, and an overall rating of High. How one gets from four clean and two bad to High — and why an average would have left it at Low — is the whole of §4.5.
What the table also teaches well is coverage, and it is worth underlining that it is a datum of the result and not a footnote. The four entities have 6 of 6 because all four records are complete. An entity with 3 of 6 and band Medium is not comparable with an entity with 6 of 6 and band Medium, however much the column says the same thing, and the portfolio order of §4.6 has to know it.
The only entity in this example that loses coverage is San Miguel under the Colombian regime: 6 rated and 1 not computable — the interest gate — out of seven scored indicators. It is the only N/A in the twenty-eight entity-set combinations of this exercise, and it is, as §4.3 says, the one that matters most.
This is the question almost no register asks and the example can answer, because the module publishes seven threshold sets and the engine runs all seven over the same portfolio without changing a single input.
Table 4.10 — Distinct bands per entity across the seven published sets
| Entity | Distinct bands | Which | Reading |
|---|---|---|---|
| Aurora | 1 | Low | The verdict is data |
| Puerto Verde | 3 | Low, Medium, High | The verdict is a choice of band |
| San Miguel | 1 | High | The verdict is data |
| Cordillera | 2 | High, Low | The verdict is a choice of band, and the jump is of two |
The result is general and worth writing down as a rule and not as an anecdote: at the extremes, the rating is data; in the middle, it is rule book. Aurora comes out Low under all seven sets and San Miguel High under all seven, because they are far enough from every plausible cut-off that no reasonable calibration moves them. Puerto Verde runs through all three bands — the full range of the scale — depending on which of the seven sets is applied. For a ministry ordering its portfolio, the operational consequence is direct: the entities in the middle are the ones to be argued about with the threshold in hand, and publishing their band without publishing the set that produced it is not a result, it is an opinion without attribution.
Cordillera adds a different and worse case, the one §4.5 develops: it does not run through the range, it jumps from one extreme to the other. With six of the seven sets it comes out High; with the seventh it comes out Low, and it does not pass through Medium. The reason is that its band is produced not by an average but by a knockout, and a knockout has no gradations: it either fires or it does not. An entity whose band depends on a knockout is more sensitive to the threshold set than an entity in the middle, not less, because a change of cut-off does not move its average by a few hundredths: it removes or restores the whole rule.
The detail by indicator says where that movement comes from, and it is little and concentrated:
Table 4.11 — Cells (entity × indicator) that change band relative to the default bands
| Threshold set | Cells that change | Which |
|---|---|---|
| Indicative screen (the same set, exposed as a selectable set) | 0 | — |
| Debt ceiling, states (Brazil) | 3 | San Miguel debt burden High→Low; Cordillera debt burden High→Low; Puerto Verde debt burden Med→Low |
| Debt ceiling, municipalities (Brazil) | 3 | Cordillera debt burden High→Med; Puerto Verde debt burden Med→Low; Puerto Verde service Med→Low |
| Traffic light (Colombia) | 4 | San Miguel service High→Med; Puerto Verde debt burden Med→Low; Puerto Verde service Med→Low; Cordillera service High→Med |
| Debt over average current revenue (Peru) | 1 | Puerto Verde debt burden Med→Low |
| High-income local governments (Austral calibration) | 2 | Cordillera debt burden High→Med; Cordillera service High→Med |
| Interest anchor (India) | 0 | — |
Three observations the manual does not soften. The first: every movement is in the same direction — downwards. No set worsens any entity on any indicator relative to the indicative bands. The statutory ceilings are, without exception in this portfolio, more permissive than the firm's screen, which is what one would expect — a legal ceiling marks the point at which borrowing is prohibited, not the point at which one should worry — and which makes the indicative screen the most conservative set in the library. The second: the Colombian set lowers San Miguel's debt service from High to Medium and yet the entity stays at High. A legal regime can loosen the indicator and not change the verdict, and that is Step 4 doing its job.
And the third, which is the new one and the one that forces a rule: the two cells in the last row are the two Cordillera has badly, and moving both at once changes its verdict. It is not a statistical coincidence: a set that loosens debt burden and debt service loosens exactly the profile of a leveraged entity, which is the profile those two indicators exist to detect. When one of the two loosened cut-offs is also that of a knockout indicator, the change of set does not lower a reading: it switches off a rule. The rule of method that follows, and which §3 Step 4.4 writes: the cut-off of a knockout indicator is not moved by a threshold set unless the rule itself sets it, and when it is moved, the result has to say so to the reader's face.
A band is a boundary, and the information a band hides is how close to the boundary the entity is. The following table translates that distance into two units an analyst can argue about: points of the ratio, and millions.
Table 4.12 — Distance of each ratio to its nearest cut-off, on the default bands
| Entity | Indicator | Value | Band | Nearest cut-off | Δ ratio | Δ millions | Δ relative |
|---|---|---|---|---|---|---|---|
| San Miguel | Autonomy | 0.2419 | High | 0.30 | 0.0581 | 36.0 | 24.0 % |
| San Miguel | Debt burden | 1.2581 | High | 1.00 | 0.2581 | 160.0 | 20.5 % |
| San Miguel | Debt service | 0.1290 | High | 0.10 | 0.0290 | 18.0 | 22.5 % |
| San Miguel | Operating balance | −0.0847 | High | 0.00 | 0.0847 | 50.0 | 100.0 % |
| San Miguel | Liquidity | 0.4167 | High | 1.00 | 0.5833 | 35.0 | 140.0 % |
| San Miguel | Contingent liabilities | 0.5806 | High | 0.50 | 0.0806 | 50.0 | 13.9 % |
| Puerto Verde | Autonomy | 0.4486 | Medium | 0.30 | 0.1486 | 274.9 | 33.1 % |
| Puerto Verde | Debt burden | 0.7027 | Medium | 0.50 | 0.2027 | 375.0 | 28.8 % |
| Puerto Verde | Debt service | 0.0838 | Medium | 0.075 | 0.0088 | 16.3 | 10.5 % |
| Puerto Verde | Operating balance | +0.0349 | Medium | 0.05 | 0.0151 | 26.0 | 43.3 % |
| Puerto Verde | Liquidity | 1.2000 | Medium | 1.00 | 0.2000 | 30.0 | 16.7 % |
| Puerto Verde | Contingent liabilities | 0.2595 | Medium | 0.20 | 0.0595 | 110.1 | 22.9 % |
| Cordillera | Autonomy | 0.7000 | Low | 0.60 | 0.1000 | 260.0 | 14.3 % |
| Cordillera | Debt burden | 1.1538 | High | 1.00 | 0.1538 | 399.9 | 13.3 % |
| Cordillera | Debt service | 0.1154 | High | 0.10 | 0.0154 | 40.0 | 13.3 % |
| Cordillera | Operating balance | +0.0920 | Low | 0.05 | 0.0420 | 105.0 | 45.7 % |
| Cordillera | Liquidity | 1.9000 | Low | 1.50 | 0.4000 | 80.0 | 21.1 % |
| Cordillera | Contingent liabilities | 0.1192 | Low | 0.20 | 0.0808 | 210.1 | 67.8 % |
| Aurora | Autonomy | 0.7262 | Low | 0.60 | 0.1262 | 530.0 | 17.4 % |
| Aurora | Debt burden | 0.4048 | Low | 0.50 | 0.0952 | 399.8 | 23.5 % |
| Aurora | Debt service | 0.0619 | Low | 0.075 | 0.0131 | 55.0 | 21.2 % |
| Aurora | Operating balance | +0.1026 | Low | 0.05 | 0.0526 | 205.1 | 51.3 % |
| Aurora | Liquidity | 1.6842 | Low | 1.50 | 0.1842 | 70.0 | 10.9 % |
| Aurora | Contingent liabilities | 0.1405 | Low | 0.20 | 0.0595 | 249.9 | 42.3 % |
The millions column is what makes the table arguable, because it translates the boundary into a magnitude that appears in a budget. Four readings:
The most fragile cell in the portfolio is Puerto Verde's debt service: 16.3 million. An increase of 16.3 in annual service — 10.5 % more than it pays — takes it from Medium to High on the indicator that is a solvency knockout, and with it its overall rating to High without any legal regime being needed. On 1,850 of total revenue, 16.3 is less than 1 %. It is the figure an analyst should take to the meeting: not "Puerto Verde is Medium", but "Puerto Verde is Medium and is 16 million away from not being".
Relative distance orders the priorities for verifying the data. San Miguel's contingent liabilities are 13.9 % away from their band, and contingent liabilities are precisely the worst-measured family of the exercise — a single aggregate field, no breakdown, no register. When the ratio with the least reliable datum is also the one closest to the cut-off, the year's work is not to recalibrate the threshold: it is to go and find the datum.
And the column also says where there is nothing to argue about. San Miguel's operating balance is 100 % away from its boundary value: the whole current deficit, 50 million on 590 of current revenue, would have to be eliminated for it to stop being High. Its liquidity is 140 % away. Those two cells are not a matter of threshold; they are the entity.
The fourth reading comes from Cordillera and it is the one a credit committee should have framed on the wall. Its debt service is 40 million away from ceasing to be the high band — 13.3 % of what it pays, on 2,600 of total revenue, that is 1.5 % of its budget — and that indicator is the one that fires its knockout. Forty million separate Cordillera from losing the High rating and coming out, with everything else identical, at Low: the weighted average without that knockout is 1.800 and the simple one 1.667, both below the high-band cut-off. A refinancing that lengthens maturities without reducing a single unit of debt — which does not improve solvency at all, it merely pushes the maturity out — lowers its annual service and changes its published band. It is the manual's strongest argument for publishing the distance to the cut-off alongside the band: without it, the reader cannot tell an entity that is far from its boundary from one that can cross it with a treasury operation.
The roll-up is knockout first, weighted average afterwards. The example makes it possible to see the two halves separately, because the weighted average can be computed with the knockout disabled and compared with what is published. And one of the four entities exists precisely so that that comparison has something to teach.
Cordillera has four clean ratios and two bad ones. The two bad ones are debt burden (weight 2.0) and debt service (weight 3.0, and also a knockout) — the two debt indicators of the set. The four clean ones are autonomy, operating balance, liquidity and contingent liabilities. With that profile, three different calculations give three different answers, and the product publishes the third:
Table 4.13 — How Cordillera's rating is formed, weight by weight
| Indicator | Value | Band | Band value | Weight | Weight × value | Knockout? |
|---|---|---|---|---|---|---|
| Revenue autonomy | 0.7000 | Low | 1 | 1.0 | 1.0 | — |
| Debt burden | 1.1538 | High | 3 | 2.0 | 6.0 | — |
| Debt service | 0.1154 | High | 3 | 3.0 | 9.0 | yes |
| Operating balance | +0.0920 | Low | 1 | 3.0 | 3.0 | yes (does not fire) |
| Liquidity | 1.9000 | Low | 1 | 2.0 | 2.0 | — |
| Contingent liabilities | 0.1192 | Low | 1 | 1.5 | 1.5 | — |
| Totals | 12.5 | 22.5 |
Table 4.14 — The three readings of the same profile
| Reading | Calculation | Result | Band |
|---|---|---|---|
| Simple average of the six bands — what a spreadsheet would do | (2 × 3 + 4 × 1) ÷ 6 | 1.667 | Low |
| Severity-weighted average — what the engine computes before the knockout | 22.5 ÷ 12.5 | 1.800 | Medium |
| Published rating — after the knockout | debt service in the high band | — | High |
The two mechanics of Step 4 are kept apart on a single entity, and it is worth reading each jump for what it teaches.
From the simple average to the weighted one: the weights alone already move the band. Two ratios of six in the high band give 1.667 on a simple average, which is the low band with room to spare. The same two ratios, weighted, give 1.800, which is the medium band. The difference is 0.133 points and it is enough to cross the 1.75 cut-off, because Cordillera's two bad ratios are the ones that weigh 2.0 and 3.0 — five of the set's twelve and a half points, 40 % of the total weight in two indicators out of six. This is where one can see what the weights are for: they are not an ornament on the average, they are the assertion that not every ratio says the same thing about the capacity to pay. An entity that fails on liquidity and contingent liabilities and another that fails on debt service and debt burden have the same count and do not have the same problem.
From the weighted average to the published rating: the knockout does not average, it overrides. Cordillera's debt service is 0.1154 against a cut-off of 0.10, and that indicator is a solvency knockout: its high band forces the overall rating and the weighted average is never even compared with the cut-offs. It is the rule working exactly where it should: an entity that devotes 11.5 % of all its revenue to paying principal and interest is not an intermediate risk, however many clean ratios go with it. And it is a rule an average cannot imitate: for the weighted average to reach the high band on its own, four or five bad ratios would be needed, and by then the entity would already be a case and not a finding.
And the debt burden, on its own, would not have been enough. It is worth saying because it separates the two things the table mixes: Cordillera's debt burden is 1.1538, high band, with a weight of 2.0 — and it is not a knockout. If debt service were in the low band and everything else the same, the weighted average would be 1.320 and the entity would come out Low. The script measures it and it can be checked in a line: a high stock of debt weighs, but what condemns is the flow that has to be paid this year. It is the distinction between how much is owed and how much has to be paid now, and the method keeps it with different weights and with a different rule.
Table 4.15 — The four entities, with their three figures on show
| Entity | Distinct bands across its six ratios | Simple average | Band | Weighted average | Band | Published |
|---|---|---|---|---|---|---|
| San Miguel | 1 (all High) | 3.000 | High | 3.000 | High | High |
| Cordillera | 2 (High, Low) | 1.667 | Low | 1.800 | Medium | High |
| Puerto Verde | 1 (all Medium) | 2.000 | Medium | 2.000 | Medium | Medium |
| Aurora | 1 (all Low) | 1.000 | Low | 1.000 | Low | Low |
The first three rows of the pack have their six ratios in a single band, and with that profile any set of weights gives the same number: the simple and the weighted average coincide exactly, and San Miguel's knockout overrides nothing because its weighted average was already 3.000. The roll-up rule was there and could not be seen working. The mixed-profile entity is the one that makes it visible, and that is the reason it was added to the demonstration pack instead of being illustrated with a case loaded by hand: a rule that can only be demonstrated with an invented example is not demonstrated in the product.
Table 4.16 — Where the knockout changes the result, set by set
| Set | Entity | Knockouts in the high band | Weighted avg. | Band of the avg. | Simple avg. | Published |
|---|---|---|---|---|---|---|
| Default | San Miguel | service, balance | 3.000 | High | 3.000 | High |
| Default | Cordillera | service | 1.800 | Medium | 1.667 | High |
| Default | Puerto Verde | — | 2.000 | Medium | 2.000 | Medium |
| Default | Aurora | — | 1.000 | Low | 1.000 | Low |
| Brazil, states | San Miguel | service, balance | 2.680 | High | 2.667 | High |
| Brazil, states | Cordillera | service | 1.480 | Low | 1.333 | High |
| Brazil, states | Puerto Verde | — | 1.840 | Medium | 1.833 | Medium |
| Brazil, municipalities | San Miguel | service, balance | 3.000 | High | 3.000 | High |
| Brazil, municipalities | Cordillera | service | 1.640 | Low | 1.500 | High |
| Brazil, municipalities | Puerto Verde | — | 1.600 | Low | 1.667 | Low |
| Colombia | San Miguel | balance | 2.760 | High | 2.833 | High |
| Colombia | Puerto Verde | interest gate | 2.000 | Medium | 2.000 | High |
| Colombia | Cordillera | interest gate | 1.839 | Medium | 1.714 | High |
| Colombia | Aurora | — | 1.000 | Low | 1.000 | Low |
| Peru | San Miguel | service, balance | 3.000 | High | 3.000 | High |
| Peru | Cordillera | service | 1.800 | Medium | 1.667 | High |
| Peru | Puerto Verde | — | 1.840 | Medium | 1.833 | Medium |
| High income (Austral) | San Miguel | service, balance | 3.000 | High | 3.000 | High |
| High income (Austral) | Cordillera | — | 1.400 | Low | 1.333 | Low |
| High income (Austral) | Puerto Verde | — | 2.000 | Medium | 2.000 | Medium |
| India | San Miguel | service, balance | 2.806 | High | 2.857 | High |
| India | Cordillera | service | 1.645 | Low | 1.571 | High |
| India | Puerto Verde | — | 1.806 | Medium | 1.857 | Medium |
(Aurora comes out 1.000 and Low under all seven sets; its repeated rows are omitted.)
With the fourth entity, the result this table produces is no longer that of a portfolio where the knockout hardly ever matters. Across the twenty-eight entity-set combinations of the seven published sets, the knockout changes the result seven times, and six of those seven are Cordillera (the seventh is Puerto Verde under the Colombian regime, whose interest gate at 141.7 % takes it from Medium to High). Read it slowly: under six of the seven sets, the mixed-profile entity is published in a band its weighted average does not support — and under three of them, the two Brazilian ones and the Indian one, the weighted average does not even reach the medium band: it is at Low and the entity is published High.
The two readings of the result, and both are true.
The favourable one: when the knockout acts, it acts where it should. The cases where it differs from the average are the cases where a solvency test — the annual flow of debt service, or a legal gate that prohibits borrowing — says the entity cannot sustain what it has. An average that diluted that into four clean ratios would be producing a dangerous number, and Cordillera is the proof that it would: four of its six ratios are impeccable and the entity owes 1.15 times its annual revenue.
The unfavourable one, and it is new: the knockout is the only thing holding up the verdict, and therefore Cordillera's band is fragile to calibration. Under the only set in the library that moves both debt cut-offs at once — Austral's calibration for high-income local governments — the knockout does not fire, the weighted average falls to 1.400 and the entity comes out Low. The same entity, the same day, the same accounts: High under six sets and Low under the seventh, without passing through Medium. That is not a criticism of that calibration, which is honestly labelled as the firm's own and reasoned for a type of local government that this is not; it is a criticism of applying a set to an entity whose profile is not the one the set describes, and of publishing the result without saying which set produced it. §3 Step 9 turns that into a mandatory field of every published figure.
Cordillera shows the knockout working. What follows shows it failing, and a case loaded by hand is needed because no entity in the pack is at the boundary: the high band of the operating balance begins at exactly zero, and none of the four has its current account pinned there. The four cases below are constructed, they are declared as such, and they are the only part of this subsection that does not come from the demonstration pack.
Table 4.17 — Four cases constructed on an otherwise healthy entity
| Case | Operating balance | Weighted avg. | Band of the avg. | Overall rating |
|---|---|---|---|---|
| Current budget exactly in balance | 0.0000 | 1.480 | Low | High |
| Current surplus of one ten-thousandth | +0.0001 | 1.240 | Low | Low |
| Current surplus of one percentage point | +0.0100 | 1.240 | Low | Low |
| No debt, no debt service and no contingent liabilities, with a current deficit of 0.5 % | −0.0050 | 1.480 | Low | High |
The first pair is a two-band jump for one ten-thousandth: the entity with its current budget pinned at zero comes out High and the same entity with an invisible surplus comes out Low. It happens because the knockout jumps straight to High and the intermediate Medium band only takes part in the weighted average; there is no rung between the two. A current deficit of one ten-thousandth and one of 5 % get the same treatment, and in subnational solvency those two things do not resemble each other.
The fourth case is worse and is the one with no defence: the tool rates as high risk an entity with no debt, no debt service and no contingent exposure, for half a point of current deficit. Its weighted average leaves it at 1.480, which is Low with room to spare. The operating balance knockout is a statement about the capacity to service debt, and an entity with no debt has no debt to service. That result is not conservative: it is wrong, and it is moreover the one a small municipality with no access to credit is going to receive most often.
Note that the defect belongs to the operating balance knockout and not to the knockout rule: the debt service one, which is the one that condemns Cordillera, has neither of the two problems — its high band begins at 0.10 and not at zero, and a high debt service is by construction a statement about debt that exists. The two corrections §3 Step 4 proposes are therefore aimed only at the first, and they are engine changes and not threshold changes: grade the operating balance knockout by magnitude — for instance, fire below −2 % and not at exactly zero — or let it set a floor in the intermediate band instead of jumping to High; and condition it on non-trivial leverage. With either of the two, the four cases in table 4.17 order themselves as a reader would expect. Until they are implemented, the method asks that a High rating produced only by the operating balance knockout be published with its weighted average alongside: it is the only way for the reader to tell an insolvency from an accounting zero.
And a publication rule Cordillera forces to be written separately, because its case is the opposite one: when the knockout fires and the weighted average says something else, both figures are published. Not because the average corrects the knockout — it does not correct it, the knockout rules — but because the distance between the two is the measure of how concentrated the problem is. A High entity with an average of 3.000 is bad at everything; a High entity with an average of 1.800 is bad at two things and good at four, and they are two different files with two different work plans.
Step 5 inventories what can turn into cash and is not financial debt. They are four families with different routes to materialisation, and the first difficulty of the example is that the tool has a single aggregate field for contingent liabilities and no field for accrued and unpaid obligations. The breakdown that follows is therefore a declared assumption of the exercise: the first three families add up to the aggregate field the tool does have, and the fourth is declared separately.
Table 4.18 — The four families, with their declared breakdown
| Family | Aurora | Puerto Verde | San Miguel | Cordillera | Total |
|---|---|---|---|---|---|
| Guarantees granted by the entity, at face value | 250 | 300 | 180 | 150 | 880 |
| Enterprises, corporations and transferred services | 280 | 130 | 120 | 110 | 640 |
| Litigation | 60 | 50 | 60 | 50 | 220 |
| Sum of the three = the tool's aggregate field | 590 | 480 | 360 | 310 | 1,740 |
| Accrued and unpaid obligations (no field in the tool) | 120 | 95 | 48 | 40 | 303 |
Four treatment rules, each with its consequence in this example.
Guarantees are recorded by their stock, not by their expected cost, and this manual does not value them. The 880 of guarantees the four entities granted — to their enterprises, to their corporations, to third parties — enter here at face value because what the diagnostic needs to know is the size of the commitment. Putting a price on the probability of being called is the work of the series' guarantees manual, and the boundary between the two manuals is one of valuation, not of inventory: here the stock is published, there the expected cost, and the consolidated register takes one of each. Adding the two would be counting twice.
A municipal enterprise of material size is an object of two manuals at once. Aurora's 280 correspond for the most part to the guaranteed debt of its water company, which Step 0 excluded from the perimeter and named. Here it appears as contingent exposure of the state; its own diagnostic — whether the company is a market producer, whether its equity survives a bad year — is the business of the state-owned enterprise manual. When a subnational government has a utility company of material size both manuals are run, and the rule for not counting twice is that M10 records it as a contingent liability of the government and not as debt of the government.
What is accrued and unpaid is not contingent: it is certain and merely late, and that is why it goes outside the aggregate. It is measured against two denominators, because the two say different things:
Table 4.19 — The two readings of accrued and unpaid expenditure
| Entity | Accrued and unpaid | Over total revenue | In months of current expenditure |
|---|---|---|---|
| Aurora | 120 | 0.0286 | 0.41 |
| Puerto Verde | 95 | 0.0514 | 0.69 |
| San Miguel | 48 | 0.0774 | 0.90 |
| Cordillera | 40 | 0.0154 | 0.21 |
The second column orders the entities almost as the diagnostic does; the third says what it means. San Miguel owes its suppliers almost a month of operations; Aurora, less than half a week of each month. In this portfolio none of the four is in grave territory — §4.7 shows an entity that owes 4.55 months — but the months column is the one to take to a meeting, because a percentage of revenue tells nobody how long whoever is not paying can keep operating.
And there is a discrepancy worth pointing out because it is exactly the sort of thing this step exists to produce: Cordillera is the entity with the fewest accrued and unpaid obligations in the portfolio — 0.21 months of expenditure — and it is the second-worst rated. Its problem is not here: it is in the financial debt, which is 1.15 times its revenue. Step 5 does not confirm the Step 4 diagnostic, it complements it, and an entity can be bad on one and good on the other. A register that looked only at accrued and unpaid expenditure would put Cordillera at the back of the queue of concerns.
And the fourth rule, which is the most important: the families are not added to financial debt without a label. The temptation of the single column is strong, because all four are debts in the ordinary sense of the word. Measured:
Table 4.20 — What happens if everything is added into a single column
| Entity | Financial debt | + contingent liabilities | + accrued and unpaid | "Total debt" | Over revenue | Band it would give | Real band |
|---|---|---|---|---|---|---|---|
| Aurora | 1,700 | 590 | 120 | 2,410 | 0.5738 | Medium | 0.4048 Low |
| Puerto Verde | 1,300 | 480 | 95 | 1,875 | 1.0135 | High | 0.7027 Medium |
| San Miguel | 780 | 360 | 48 | 1,188 | 1.9161 | High | 1.2581 High |
| Cordillera | 3,000 | 310 | 40 | 3,350 | 1.2885 | High | 1.1538 High |
Two of the four entities worsen by a whole band under the indiscriminate sum, and none improves. Cordillera does not move — it was already in the high band on its financial debt alone — and that teaches the other half of the argument: the indiscriminate sum does not distinguish between the entity that is in the high band because of contracted debt and the one that gets there by adding guarantees that may never be called. Puerto Verde and Cordillera both come out "High" in the single column, and one owes 1.15 times its revenue in enforceable debt and the other 0.70. It is an error with a constant direction, like the transfers one in §4.2, but of the opposite sign: this one overstates. And overstating is not the prudent option it looks like, for two reasons. The first is that it destroys the portfolio's order: if every entity worsens at once, the prioritisation flattens out. The second is about enforceability: a guarantee that may never be called, an invoice due next month and a bond with a half-yearly coupon have different maturities and different consequences, and the single column treats them alike. The method's rule is that each family carries its label and its maturity, and that the total, if published, is published as what it is: an inventory, not a leverage ratio.
Table 4.21 — The method's order, with its tie-break criterion
| Rank | Entity | Band | Weighted severity | Coverage |
|---|---|---|---|---|
| 1 | San Miguel | High | 3.000 | 6 of 6 |
| 2 | Cordillera | High | 1.800 | 6 of 6 |
| 3 | Puerto Verde | Medium | 2.000 | 6 of 6 |
| 4 | Aurora | Low | 1.000 | 6 of 6 |
The order is first by band and then by weighted severity within the band, which is the same quantity Step 4 uses to roll up. The table therefore contains an apparent inversion that has to be explained before a reviewer reads it: Cordillera is second with a severity of 1.800 and Puerto Verde third with 2.000. It is not an ordering error. Severity orders within the band and not between bands, and Cordillera is in the high band because of a knockout its average does not reflect. It is the practical consequence of the rule in §4.5: when the knockout rules, the weighted average stops being comparable with another entity's and becomes only a datum about how concentrated the problem is. Publishing both columns — band and severity — is what makes it possible to see that the two high-band entities of this portfolio are very different cases: San Miguel is bad on all six ratios, Cordillera on two. It is not by size, and that is the methodological decision that has to be defended: in a subnational portfolio the large healthy entity is not a fiscal problem and the small insolvent one is, because the central level responds not in proportion to the budget but to the insolvency. Size enters afterwards, when Step 7 translates the bands into amounts, and there Aurora reappears by way of its guarantee.
An entity that is not computable orders last and never displaces one in the high band. In this example there is none; the case exists and §3 Step 6 sets it as a rule, because the error of putting it at the top — "we do not know, so let us worry" — empties the priority list just as putting it at Low does.
The order a spreadsheet would produce does not resemble this one, and it is measured. Ordered by stock of financial debt, the portfolio comes out Cordillera (3,000) > Aurora (1,700) > Puerto Verde (1,300) > San Miguel (780), and the method orders it San Miguel > Cordillera > Puerto Verde > Aurora. The entity the spreadsheet declares healthiest — San Miguel, with 780 of debt — is the insolvent one, and the one the spreadsheet puts second — Aurora, with 1,700 — is the only Low in the portfolio.
With three entities that permutation was the exact inverse of the method's order, and the example published it that way. With the fourth it no longer is, and the correction is worth more than the lost headline: Cordillera coincides at the top on both lists. The stock of debt of a subnational government is, to a first approximation, proportional to its capacity to borrow — ordering by debt is ordering by access to credit, and §6.1 develops the argument — but the proportion is not exact, and sometimes the most indebted entity is a problem. What the spreadsheet cannot do is not to get it right ever: it is to know when it gets it right. The list by stock puts Cordillera first for the wrong reason — it is the largest after Aurora — and San Miguel last for the wrong reason — it is the smallest — and it happens that in the first case the result resembles the correct one. An order that gets one entity out of four right by chance and fails spectacularly on another is not an order: it is noise with a coincidence inside it.
Table 4.22 — The portfolio aggregates
| Aggregate | Value | Over the portfolio's revenue |
|---|---|---|
| Total revenue | 9,270 | — |
| Debt outstanding | 6,780 | 0.7314 |
| Debt service | 795 | 0.0858 |
| Contingent liabilities | 1,740 | 0.1877 |
And the experiment that justifies the rule: rating the aggregate portfolio as if it were a single entity.
Table 4.23 — Lemuria's portfolio, treated as one entity
| Indicator | Aggregate value | Band |
|---|---|---|
| Revenue autonomy | 0.6311 | Low |
| Debt burden | 0.7314 | Medium |
| Debt service | 0.0858 | Medium |
| Operating balance | +0.0735 | Low |
| Liquidity | 1.5506 | Low |
| Contingent liabilities | 0.1877 | Low |
| Overall rating | weighted average 1.400 | Low |
The aggregate portfolio comes out Low while half its entities are at High. It is the result the Step 6 rule anticipates and that is measured here, and with four entities it is graver than with three: two of the four — San Miguel and Cordillera — are in the high band, between them they owe 3,780 of financial debt, and the aggregate comes out Low with a weighted average of 1.400, four of its six indicators in the low band.
The mechanism is compensation between entities, and it can now be seen working both ways. Aurora and Cordillera contribute 73 % of the aggregate's revenue and drag the flow indicators with them: San Miguel's current deficit of 50 million disappears inside an aggregate surplus of 640. And the aggregate liquidity comes out at 1.5506, the low band, when San Miguel has 0.4167 — because Aurora's 640 of liquid assets and Cordillera's 380 cover, in the sum, everybody's short-term obligations. One entity's liquid assets are not available to pay another's obligations, and adding them is exactly the opposite assertion.
A ministry publishing "the subnational portfolio's average headroom is comfortable" would be saying something arithmetically correct and fiscally false. The aggregate is always published with its distribution by band — here 2 High, 1 Medium, 1 Low — and with the list of entities in the high band. That is the reading; the average is context.
The order and the aggregates above treat the four entities as independent observations. They are not. All four share Lemuria's business cycle, Lemuria's transfer formula, and the rate at which Lemuria borrows. A shock that narrows San Miguel's current balance will narrow Puerto Verde's too, and a cut in transfers hits both in the same direction and in the same year. And there is a correlation channel this portfolio makes visible and that an entity-by-entity analysis does not see: Cordillera is 40 million of annual service away from changing band, so that a rise in rates that makes its refinancing dearer does not worsen an indicator — it takes it across a knockout. In a portfolio with several entities near a cut-off, a common move in rates produces several band changes at once, which is the opposite of what a portfolio average suggests.
Two consequences. The first: adding up the entities' worst cases assumes perfect correlation and has to be labelled an upper bound, never a scenario. The upper bound of the implicit channel in §4.8 carries that label for that reason. The second: the portfolio of a subnational debt unit is a correlated portfolio and its tail is not the sum of the individual tails; the formal treatment belongs to the firm's portfolio literature (Stress-Testing PPP Portfolios), and the tool does not implement it. What the method requires until it does is the label.
There is a product limit that bears directly on this section and it has to be declared before the reader compares this subsection with the screenshots of §5. The screen that produces the portfolio order — Batch Compare — has no liquidity fields: it rates with five indicators where the individual assessment screen rates with six. Loading a seeded entity into it silently discards its two liquidity fields, and since the missing liquidity indicator is not declared not computable and does not trigger the incomplete-assessment flag, the difference appears nowhere.
Table 4.24 — The same portfolio on the two screens
| Entity | Individual assessment (indicators / flags / band) | Batch Compare (indicators / flags / band) |
|---|---|---|
| Aurora | 6 / 0 / Low | 5 / 0 / Low |
| Puerto Verde | 6 / 0 / Medium | 5 / 0 / Medium |
| San Miguel | 6 / 6 / High | 5 / 5 / High |
| Cordillera | 6 / 2 / High | 5 / 2 / High |
On this portfolio the bands do not move: one indicator is lost in all four, and one flag only in San Miguel, because it is the only one whose liquidity is in the high band. But the defect is not benign, and it is demonstrated with an entity built for the case — autonomy 0.45, debt burden 0.70, service 0.05, operating balance +0.08, contingent liabilities 0.55 and liquidity 0.60:
| Screen | Indicators | Flags | Overall rating |
|---|---|---|---|
| Individual assessment | 6 | 2 | Medium |
| Batch Compare | 5 | 1 | Low |
The same entity, the same figures, two screens of the same module, two different bands and no warning. It is a defect that is invisible in the demonstration and visible in a client's data, and it has a practical consequence for this manual: subsections 4.4 and 4.6 cannot be illustrated with the same screenshot until it is corrected. Until it is, the portfolio order is computed with the full set of six — which is what the engine does and what this example publishes — and the comparison screen is used for the order and not for the ratios.
Everything above assumes the entity can borrow. There are jurisdictions where it cannot, and the clearest in the region is verified and cited by article in §2.6: Chile. Municipal assets are listed exhaustively in article 13 of the consolidated text of the organic constitutional law of municipalities, and there is in that list no paragraph on borrowings, on debt or on credit operations; article 140 closes the door from the side — "no municipal corporation, foundation or association […] may contract borrowings" — and the regime of the regional governments repeats the pattern, with two express prohibitions added in article 101 of their own organic law: their contribution to corporations and foundations may not be financed by borrowing, and they may not secure or guarantee the commitments of those entities. In that framework, the obligation the local government actually carries is not financial debt: it is accrued and unpaid expenditure — the deuda flotante, which is that jurisdiction's term: the difference, at year-end, between expenditure accrued in the year and the payments corresponding to that expenditure — plus the deficit of the transferred health and education services, plus the court-ordered obligations.
That the data exist is not the problem: they exist and they are public, and they do not come from any national budget body. The organic law obliges the administration and finance unit to report quarterly to the council the monthly detail of accumulated liabilities, broken down into the accounts payable of the municipality and of its corporations, and to keep a public monthly register of the breakdown of expenditure; the national municipal information system of the undersecretariat for regional development is where that is consolidated and published, with a budget classifier, a dictionary of variables and a commune fact sheet. With a coverage warning that §2.6 verifies and that has to be repeated here: the indicator and variable menus of that system are offered for a period that does not coincide with that of its most recent institutional publication, so that anyone about to build a series on that source must verify the coverage field by field before committing to a financial year.
The box is better understood with real municipalities on show, and in this jurisdiction they can be named because their dependence on the central transfer is a public datum, published by municipality and with the year declared. The following table reproduces a published annex to the terms of a public competition whose declared source is the national municipal information system of the undersecretariat for regional development, and it reports the indicator of dependence on the Fondo Común Municipal relative to own revenue, for the year 2023, across the 343 municipalities from which the system received the datum. It is the variable the method of §3 calls revenue autonomy, read by its complement.
Table 4.25 — Dependence on the Fondo Común Municipal relative to own revenue, year 2023, by municipality
| The eight most dependent | % | The eight least dependent | % |
|---|---|---|---|
| Isla de Pascua | 99.17 | Lo Barnechea | 2.17 |
| Juan Fernández | 96.42 | Las Condes | 2.42 |
| Camiña | 96.40 | Vitacura | 2.81 |
| Tortel | 95.91 | Providencia | 3.53 |
| Timaukel | 94.55 | La Reina | 7.29 |
| O'Higgins | 93.97 | Santiago | 8.71 |
| General Lagos | 93.51 | Huechuraba | 8.75 |
| San Rosendo | 93.43 | Zapallar | 8.77 |
Source: annex "Dependencia del Fondo Común Municipal" to the 2025 terms of the environmental protection fund of the ministry of the Environment, published at fondos.mma.gob.cl, whose declared source is the national municipal information system (datos.sinim.gov.cl/datos_municipales.php), indicator IADM75, year 2023. Two municipalities carry a note that the 2023 datum was not received and the 2022 one is shown; the annex identifies them. The exact formula with which the system computes the indicator is not published in the annex itself — [to be verified] against the system's dictionary of variables before reproducing it in a future edition.
Three things have to be read in this table, and none of them is about the municipalities.
The first: the range runs from 2.17 % to 99.17 %, and that is not a distribution, it is two countries. A municipality 99 % of whose own revenue comes from the transfer does not have a revenue autonomy problem: it has a budget that is decided somewhere else. In the vocabulary of §3, its autonomy indicator would be in the high band under any imaginable cut-off, and the result would tell the reader nothing they did not already know. The indicator discriminates where there is something to discriminate, and in the tail of the distribution it stops discriminating.
The second: the eight municipalities in the right-hand column have no autonomy problem and may have every other problem. That Las Condes funds 97.6 % of its own revenue without the transfer says nothing about its deuda flotante, its court-ordered obligations or the deficit of its transferred services, which are the three obligations this jurisdiction produces. A screen ordering Chilean municipalities by this variable alone would put those in the left-hand column at the top and those on the right at the bottom, and it would be ordering by the size of the communal tax base, which is geography and not management.
And the third, which is what this manual has to say out loud: this indicator is the only one of the six in §3 that can be computed today for a Chilean municipality from a citable public source, and of the other five, four do not apply. Debt burden, debt service and the interest gate are zero by legal mandate (§2.6); liquidity requires liquid assets and short-term obligations that the system does not publish as a pair; the operating balance requires the current split. No deuda flotante figure for a named municipality is published in this manual, because the ones that exist could not be opened and verified one by one in this edition: the system has them — it allows queries by municipality and year from 2001 and a spreadsheet download — and the verification remains [to be verified] as a task for the second edition. What is verified and cited is the sector aggregate: accrued municipal expenditure for the sector as a whole for 2024 is M$ 8,716,199,417, according to the journal of the municipal information system itself, 2025 edition.
With that warning made, the entity that follows is not any of the municipalities named above and carries no figures from any real entity: it is an entity built to show what the method does when financial debt is zero by legal mandate. The structure is that of the Chilean case; the magnitudes are the example's. Its revenue autonomy — 0.2250, that is, a dependence of 77.5 % — is deliberately inside the range table 4.25 documents, and it does not copy any municipality in it. And the calculation was not redone on the platform, because today it cannot be: there is no threshold set for this jurisdiction and no field in which to record the deuda flotante.
Table 4.26 — An entity with no ordinary borrowing
| Input | Value |
|---|---|
| Total revenue | 400 |
| Own revenue | 90 |
| Transfers | 310 |
| Current revenue | 380 |
| Current expenditure | 396 |
| Debt outstanding | 0 |
| Debt service | 0 |
| Liquid assets | 12 |
| Short-term obligations (of which, accrued and unpaid: 150) | 150 |
| Contingent liabilities | 120 |
Its real obligation, in the two readings of Step 5: 150 million of accrued and unpaid expenditure, which is 37.5 % of its total revenue and 4.55 months of its current expenditure. An entity that owes its suppliers four and a half months of operations.
And this is what the six screening indicators see:
Table 4.27 — The diagnostic of an entity that cannot borrow
| Indicator | Value | Band | Weight | Knockout |
|---|---|---|---|---|
| Revenue autonomy | 0.2250 | High | 1.0 | — |
| Debt burden | 0.0000 | Low | 2.0 | — |
| Debt service | 0.0000 | Low | 3.0 | yes |
| Operating balance | −0.0421 | High | 3.0 | yes |
| Liquidity | 0.0800 | High | 2.0 | — |
| Contingent liabilities | 0.3000 | Medium | 1.5 | — |
| Overall rating | High | weighted average 2.080 (Medium) |
Read the table by the weights and not by the bands. The two highest-weighted indicators of the set — debt burden with 2.0 and debt service with 3.0, half the total weight — come out Low, and they come out Low because the law prohibits borrowing. Five of the method's twelve weight points are rewarding compliance with a prohibition. And the debt service knockout, which is the most consequential in the set, can never fire in this jurisdiction: there is no debt service that can exceed any cut-off.
The only thing that saves the verdict is the operating balance knockout, which fires on a current deficit of 4.21 %. Without it, this entity's weighted average is 2.080: band Medium. That is, the entity that owes its suppliers four and a half months of operations comes out "intermediate risk" as soon as its current account stops being in deficit. And that can perfectly well happen, because the deuda flotante is a stock and the current deficit is a flow: a year's current account can be balanced without paying a single unit of what has been carried over from previous years. Measured:
Table 4.28 — The same entity, three variants
| Variant | Operating balance | Liquidity | Indicators | Flags | Overall |
|---|---|---|---|---|---|
| As it stands, with a current deficit | −0.0421 (High) | 0.0800 (High) | 6 | 3 | High |
| Current account in balance, accrued and unpaid reported | +0.0263 (Medium) | 0.0800 (High) | 6 | 2 | Medium |
| Current account in balance, accrued and unpaid not reported | +0.0263 (Medium) | — | 5 | 1 | Low |
The third row is the one to look at. An entity with 150 million of unpaid invoices — 4.55 months of operations — that balances its current account and does not report its short-term obligations comes out of the screen at Low, with five indicators, one flag, and no mark of incomplete assessment. There was no calculation error and no loading error: the indicator that saw the problem simply ceased to exist, because its denominator was absent, and the tool omits it silently instead of declaring it not computable. It is the defect §6.4 measures as the most expensive in the method, and it is here that it is seen whole: it rewards whoever reports least, and it rewards them precisely in the jurisdiction where the omitted information is the only obligation that matters.
And in the portfolio, the entity with no ordinary borrowing puts the order to the test. Added to Lemuria's four:
| Rank | The method's order | Band | Order by stock of debt | Stock |
|---|---|---|---|---|
| 1 | San Miguel | High | Cordillera | 3,000 |
| 2 | The entity with no borrowing | High | Aurora | 1,700 |
| 3 | Cordillera | High | Puerto Verde | 1,300 |
| 4 | Puerto Verde | Medium | San Miguel | 780 |
| 5 | Aurora | Low | The entity with no borrowing | 0 |
The method puts it second, ahead even of the province that owes 1.15 times its revenue; the stock of debt puts it last of five, with the best possible record. A subnational register ordered by bank credit in a country with this legal framework would return a flat list with every entity at zero and would give first place for good health to the one that cannot pay its suppliers.
What the method does with this case, and what the tool still does not. The method declares the two debt indicators not applicable instead of rewarding them, replaces their weight with an indicator of accrued and unpaid obligations over revenue and over months of current expenditure, and publishes the diagnostic with the reduced coverage and the reason for the reduction. The tool has neither an accrued-and-unpaid indicator nor a threshold set for this jurisdiction, so that today this case cannot be run on the platform and the box carries no screenshot. It is the reason the main example of this manual is a portfolio with borrowing: under this framework, the example would teach the method backwards. And it is the reason this box is, probably, the most useful passage of the manual for a reader in the region — a method that recognises where it does not apply is worth more than one that applies everywhere.
This is the step a ministry of finance reads this manual for, and it has to be opened with the declaration that belongs to it: the tool does not run it. The diagnostic ends in a band and does not produce a single monetary figure of exposure. Everything that follows is explicit arithmetic on inputs that are not fields of the module and that the analyst writes outside it. They are published here precisely so that the reader can see what remains to be asked of the tool.
Table 4.29 — The Step 7 inputs, declared
| Input (outside the tool) | Aurora | Puerto Verde | San Miguel | Cordillera | Total |
|---|---|---|---|---|---|
| Entity's debt with an explicit central-level guarantee | 340 | 520 | 210 | 600 | 1,670 |
| Central-level on-lent loans outstanding | 0 | 180 | 95 | 160 | 435 |
| — of which, in arrears | 0 | 0 | 38 | 0 | 38 |
| Discretionary transfers for the year (not by formula) | 60 | 140 | 165 | 70 | 435 |
Cordillera's five inputs are new assumptions of this edition, calibrated on the same criterion as the previous three — an explicit guarantee of the order of 20 % of its stock of debt, as in Aurora; no on-lent loans in arrears; and a low discretionary transfer because its revenue autonomy is 70 % — and they are marked as such in the script. Those of the other three entities are confirmed and did not change.
Note which datum was needed and where it comes from: the discretionary transfers are a fraction of the transfers field the tool already asks for and does not use (§4.2). The datum that changes no indicator of the diagnostic is exactly the datum Step 7 needs, and separating the formula part from the discretionary part is a loading job, not an engine job.
Table 4.30 — The four channels, declared separately and never added to each other
| Channel | Nature | Amount | % of output (60,000) | % of central revenue (13,200) |
|---|---|---|---|---|
| 1 · Subnational debt with an explicit guarantee | stock | 1,670 | 2.78 % | 12.65 % |
| 2 · Intergovernmental debt (on-lent loans) | stock | 435 | 0.72 % | 3.30 % |
| — of which, in arrears | stock | 38 | 0.06 % | 0.29 % |
| 3 · Discretionary transfers | flow for the year | 435 | 0.72 % | 3.30 % |
| 4 · Implicit rescue | not quantified | — | — | — |
The two totals that are published, one of stock and one of flow, because mixing them is the error this table exists to prevent:
| Total | Amount | % of output | % of central revenue |
|---|---|---|---|
| Explicit stock exposure (channels 1 + 2) | 2,105 | 3.51 % | 15.95 % |
| Realised fiscal cost for the year (channel 3) | 435 | 0.72 % | 3.30 % |
Four readings, in the order a ministry needs them.
The figure a conventional register would publish is 26 % short. A register looking only at the explicit guarantee — which is what almost everyone looks at, because it is the only channel that is written down and signed — publishes 1,670, 2.78 % of output. The method publishes 2,105, 3.51 %. The difference is the 435 of on-lent loans: credit the central level gave directly to three of the four entities, of which 38 are in arrears, and which appears in no guarantee register because it is not a guarantee: it is a receivable. No error was needed to omit it; what was needed was not having the column.
The arrears are the signal, not the amount. 38 million are 0.06 % of output and move no aggregate figure. But they are an on-lent loan from the central level that an entity is already not paying, in one of the two that are in the high band. Step 7 asks that signals of materialisation be published alongside the exposure and not inside it: an exposure of 2,105 with 38 in arrears is not the same as an exposure of 2,105 with none. And its counterpart: Cordillera is the other entity in the high band, with 760 of explicit exposure between guarantee and on-lent loan, and it has no signal of materialisation. Two entities in the same band and two different files: San Miguel's has already started to cost money, Cordillera's has not yet.
The channel that happens every year is the one nobody calls by its name. The 435 of discretionary transfers are a flow already paid: money that left the central budget this year towards these four entities by discretionary decision and not by formula. 3.30 % of central-level revenue. And its distribution is the reading: 165 of the 435 go to San Miguel, the smallest of the four — 27 % of its own total revenue of 620 — while Cordillera, which is four times larger and is also in the high band, receives 70, 2.7 % of its own. San Miguel's is not a transfer: it is an annual rescue not called a rescue, and the contrast with Cordillera is what proves it — the discretionary channel does not follow size and does not follow the band, it follows the entity that cannot pay its bills. The indicator to watch is not one year's amount but its recurrence, and to see that one needs the series this example does not have.
And the fourth channel is argued and published without a figure. San Miguel is an entity in the high band, with essential services in its charge, with negative ahorro operacional and with an on-lent loan in arrears. It has a probability of rescue nobody wrote down and every actor in the system assumes. The method asks that it be named, argued from the diagnostic itself, and given no number unless there is a basis for estimating it — and here there is none: there is no history of rescues in Lemuria, there is no comparable documented case, and publishing a probability per entity also carries a moral hazard cost that the supervisory doctrine of §2.1 expressly warns about.
What can be published is an upper bound labelled as such: if the central level absorbed all of San Miguel's obligations, they would be 1,140 — 780 of debt plus 360 of contingent liabilities — 1.90 % of output. That figure assumes perfect correlation and total absorption, that is, it is the arithmetical worst case and not a scenario. It is not added to the explicit channels, because part of those obligations is already counted in channel 1.
And a decision of method that the second high-band entity forces: the bound is published by entity and not summed. Cordillera's equivalent bound would be 3,310 — 3,000 of debt plus 310 of contingent liabilities, 5.52 % of output — and adding it to San Miguel's would give 4,450, 7.42 %, which is a figure without meaning: it assumes the central level absorbs both portfolios in full in the same year. Cordillera, moreover, is the case where the upper bound is most misleading, because its debt is debt contracted with creditors who are being paid today: what the central level would absorb in a rescue is not the stock, it is the flow the entity stops servicing. The method publishes the bound by entity, labelled, and with no total, and leaves the argument to the reader.
The final destination of this diagnostic is the fiscal risk statement, which receives the subnational portfolio as one family of the register. The row, with what this example can fill in and what it cannot:
Table 4.31 — The row of the consolidated register
| Register field | Value | Where it comes from |
|---|---|---|
| Family | subnational governments | the register's taxonomy |
| Entities in the perimeter | 4 of 42 | Step 0, with its list of exclusions |
| Gross exposure (stock) | 2,105 · 3.51 % of output | Step 7, channels 1 + 2 |
| Realised fiscal cost for the year | 435 · 0.72 % of output | Step 7, channel 3 |
| Signals of materialisation | 38 in arrears, in one entity | Step 7, channel 2 |
| Probability | not estimated | decision of method: not published by entity |
| Distribution by band | 2 High · 1 Medium · 1 Low | Step 4 |
| Coverage of the diagnostic | 6 of 6 in all four | Step 3 |
| Stressed cost | not computed | the tool has neither scenario nor glide path |
Three things about this row deserve saying, because they are where the method and the register do not quite fit.
The first: the register asks for a probability and this method deliberately does not produce one. It is not a shortcoming of the tool: it is a position. Publishing a probability of rescue per subnational government is publishing an expectation of support, and doing so invites exactly the behaviour the support should discourage. What the row carries in its place is the distribution by band, which says the same thing without putting a number on what the central level would do.
The second: the stressed cost is blank and cannot be otherwise. The tool takes one period, with no scenario and no projection, so there is no path to stress. What can be done, and is labelled as arithmetic by hand outside the tool, is a single-channel sensitivity illustration: if discretionary transfers were to double — a perfectly ordinary shock in a bad year, given that they already grow by decision and not by formula — the realised fiscal cost would go from 435 to 870, from 0.72 % to 1.45 % of output. It is an illustration, not a scenario: it has no associated probability, it has not the other three channels, and it says nothing about the following year.
And the third: today this row is written by hand. The family exists in the register's taxonomy and appears in the published document, and there is nothing to feed it from the diagnostic: the hand-off does not exist. The manual teaches how to write the row because it has to be written, and says that it should not be necessary.
The example delivers, for Lemuria, eight conclusions and a work plan.
One entity is a case, not a row. San Miguel is in the high band on all six indicators, has negative ahorro operacional, has a central-level on-lent loan in arrears, receives 165 of discretionary transfers — 27 % of its own revenue — and owes its suppliers almost a month of operations. There is no further diagnostic to ask for: there is a decision to be taken — performance plan, restructuring of its obligations, or intervention — and the method does not take it.
There is a second entity in the high band and its file is the opposite. Cordillera has four of its six ratios in the low band and two in the high one, and both are debt ratios: it owes 1.15 times its annual revenue and devotes 11.5 % of all its revenue to servicing it. It has no problem of operations, of liquidity, of autonomy or of contingent liabilities. Its weighted average is 1.800 — the medium band — and its published rating is High, because the debt service knockout fires. It is an entity solvent in its operations and not on its balance sheet, and the plan it calls for is not a performance plan but a renegotiation of the maturity profile: it is 40 million of annual service away from changing band, 1.5 % of its budget.
The entity in the middle is the one to argue about with the threshold in hand. Puerto Verde runs through all three bands depending on the threshold set applied, and it is 16.3 million — less than 1 % of its revenue — away from its solvency knockout firing on its own. Its published band is not a fact about the entity: it is a fact about the entity and about the rule book, and both are published together.
The most consequential legal test falls silent exactly where it matters most, and condemns where the diagnostic absolves. The gate of interest over ahorro operacional condemns Puerto Verde and Cordillera — the latter with an operating balance the diagnostic rates Low — and cannot be computed for San Miguel, because its ahorro operacional is negative. The entity in the worst shape is the only one with no legal result. It is a defect of the tool with a clear correction, and until it is corrected the analyst has to write by hand what the test would say.
The figure the ministry would publish was 435 short, and the difference is not a guarantee. With only the guaranteed stock, 1,670. With the four channels separated, 2,105 of stock plus 435 of annual flow. The omission did not come from an error: it came from not having the intergovernmental debt column — and inside it were the 38 in arrears, which are the only signal of materialisation in the whole portfolio.
The portfolio average says the opposite of the portfolio. The aggregate of the four entities, rated as a single one, comes out Low with a weighted average of 1.400 and four of its six indicators in the low band, while two of the four are at High and between them owe 3,780 of financial debt. And the aggregate liquidity comes out at 1.55, the low band, when San Miguel has 0.42: one entity's liquid assets do not pay another's obligations. A portfolio report is published with its distribution by band and the list of entities in the high band; the average is context and never the headline.
There is one result the method declares wrong in its own tool, and another it declares fragile. The wrong one: the operating balance knockout, firing at exactly zero and with no leverage condition, gives high risk to a balanced current budget and to an entity with no debt and no contingent liabilities for half a point of deficit. The fragile one: Cordillera's band, which is High under six of the seven published sets and Low under the seventh, without passing through Medium, because that set moves both debt cut-offs at once and disables the knockout. Until the first is graded and the second carries a warning, every high rating produced only by a knockout is published with its weighted average and its threshold set alongside.
And there are three things this exercise did not assess, declared rather than letting their absence read as a zero. San Miguel's transferred services, excluded from the perimeter and named. The trajectory of the four entities, because the tool takes one period: it is not known whether Puerto Verde's current balance has been narrowing or improving, nor whether Cordillera's debt has been growing or amortising — and in an entity whose problem is on its balance sheet, the direction matters more than the level. And the remaining 38 entities of Lemuria's register, about which this example says nothing.
The following year's plan, which is what a ministry takes away: a San Miguel file outside the calendar, with its legal gate computed by hand and its transferred services inside the perimeter; Cordillera's maturity profile, which is the datum its case needs and that no indicator of this method produces; loading of the previous financial years of all four entities so as to have a trajectory and not a snapshot; separation of the discretionary part of transfers across the 42 entities of the register, which is the Step 7 input and does not exist today; verification of San Miguel's contingent liabilities datum, which is the ratio closest to its cut-off with the least reliable datum; and the decision as to which threshold set is Lemuria's, because the firm's indicative screen is the most conservative of the seven, is the only one that moves no knockout cut-off, and using it by default is a choice nobody has explicitly made.
The figures in this section come from running the method over the seeded portfolio the platform ships with. In the demonstration workspace:
What cannot be reproduced on screen today, and where it comes from in these pages:
| Figure | Why it is not on screen |
|---|---|
| Table 4.4 (balance with and without the split) | It requires loading the same entity twice with and without the current-account split; it can be done, but it is not a result the screen offers |
| Table 4.5, table 4.17 and the variants in §4.7 | They are constructed cases, loaded by hand to measure a defect |
| Table 4.7 (superseded cut-off against the one in force) | The superseded cut-off is no longer in the library; it was run programmatically |
| Table 4.8b (what each set governs) | The library publishes the cut-offs of each set and no surface compares them with the engine's |
| Tables 4.12 to 4.16 (distances, weights and weighted average) | The engine computes the weighted average and does not publish it; nobody computes the distances to the cut-off |
| Tables 4.18 to 4.20 (Step 5 families) | The tool has one aggregate field and no accrued-and-unpaid field |
| Tables 4.22 and 4.23 (portfolio aggregates) | The comparison screen does not aggregate; the aggregate was computed separately |
| Table 4.25 (named Chilean municipalities) | It is an external public source, not the module's: there is no Chilean threshold set and no loading of those data |
| Tables 4.26 to 4.28 (entity with no borrowing) | There is no threshold set for that jurisdiction and no accrued-and-unpaid field |
| Tables 4.29 to 4.31 (Steps 7 and 8) | None of those inputs is a field of the module, and there is no hand-off to the consolidated register |
All of them are obtained by running the same engine through its programmatic interface, which §5.6 describes, and all of them are reproducible: the complete exercise is in a script versioned alongside this manual, which reads the seeded portfolio directly from the module — so that it does not fall out of sync — and reprints every table in this section.
A reproduction condition that has to be declared. The figures in this section were measured on the code tree that has the two product deliveries the example uses: the one that adds the fourth entity to the demonstration pack, and the one that corrects the Colombian set to the ceiling in force and replaces the set attributed to an agency with this firm's own calibration. Both have been delivered and neither of the two was integrated into the main branch on this edition's closing date. The script detects whether the tree it runs on has them and says so in its header: run on an earlier tree it finds three entities and the old cut-offs, and its output does not reproduce these pages. Anyone verifying these figures should check that header line first.
And what this example could not teach, declared: a trend reading or a projection, because of the single period — it is the largest limitation and §5 declares it as a product limit; an entity with partial coverage in the real portfolio, which appears only in the constructed cases; a mixed-profile entity in the medium band, because the one in this pack is resolved by a knockout; and the effect of a change of legal regime between two years, which is what Step 9 asks to be compared and which needs two financial years on the same basis.
How to read this section. It describes what the module does on the day the edition closes, verified screen by screen and label by label against the code in production and not against a plan. Where a capability is missing, it says [to be built]; where the screen does not show what the engine computes, or shows something that no longer applies, it says [to be fixed]; and where a limit this section declared is already closed, it is declared as such — because the limits list of the previous edition is what the reader remembers — struck through and marked “closed”. This edition was verified against production on 28-09-2026, after the deployment that closed ten of the corrections this section asked for. The markers [Screenshot n] are the six figures of §5, and none of them is taken before the defects marked [to be fixed] on that screen are closed: a screenshot is a statement with a date. The one exception, declared in its own caption, is Figure 5.5.
The method of §3 can be executed with any tool. This section describes how the Subnational Fiscal Risk module of the Austral platform executes it. For each screen: which step it runs, what input it asks for, what output it delivers, what the analyst decides and where the limit is. The screenshots are from the demonstration workspace with the four-entity pack and with the figures of §4 — never from a client's data — and they are numbered in the order of the method, not of the menu.
It is worth setting the expectations in the first line, because the module is honest about its scope and the manual should be no less so: the module runs six of the method's ten steps, and partially. It runs Steps 1, 3 and 4 well; it runs Step 2 only when the chosen threshold set introduces the gate; it has run Step 6 in full since 28-09, when the portfolio screen recovered the indicator it was missing; it records Step 5 in a single aggregate field. Step 0 and Step 7 have no screen at all, Step 8 has no automatic hand-off, and Step 9 has nowhere to store versions. Section 5.7 puts it in a list, with what the analyst does in the meantime in each case.
The module lives at …/workspaces/<workspace>/subnational_risk and each screen is a route under that address: the landing page, Risk Assessment (/assess), Batch Compare (/compare) and the on-screen manual (/manual). Four screens, and two exports of the risk scorecard report.
Three things have to be known before going in, and all three affect how it is used.
No run is saved. The module does not persist assessments: the screen sends the inputs, receives the result and displays it; closing the tab erases it. The practical consequence is that a result is not shared by sending a link — the link opens an empty form — and that the traceability of Step 9 is built by keeping the exports, not by going back to the screen. The only thing the workspace preserves is the seeded entities: the demonstration pack is stored as rows of the workspace, with its inputs, and the two calculation screens can load them again.
The demonstration pack is in the workspace, and it cannot be seeded from the module. The pack is four entities spread along the risk spectrum — a state with its own revenue base, a provincial capital dependent on transfers, a municipality in difficulty, and a province with a mixed profile with two bad debt ratios and four clean ones — and the two calculation screens have their selector for loading them. The fourth was added so that the pack could demonstrate the two mechanics of the Step 4 roll-up: with the first three, whose six indicators each fall in a single band, the weighted average and a simple average always coincide and the knockout never has a different verdict to override (§4.5). But the module's landing page has no seeding or reset card, unlike the platform's other modules: seeding exists only in the header of the module's standalone application. So a user coming in through the platform finds the entity selector empty and a note telling them to seed the pack "from the module panel", where there is nothing to do it with. [to be fixed]
The Batch Compare ceiling is a hundred entities. Above that figure the call is rejected instead of truncating the list, which is the correct behaviour: one omitted entity corrupts the distribution by band, which is the headline of Step 6.
And a point of form. The module is translated into Spanish on the screens and in the on-screen manual, and the indicator labels come back translated from the engine. What is not translated, by declared design, are the Low / Medium / High bands and the indicator keys: they are the product's taxonomy, the manual does not give the reader a word different from the one on the screen, and this section does the same. There are two exceptions that are not design but defects, and they are in 5.3.
Route: …/subnational_risk. Input: none. Output: the module's card with its thesis, its declared methodological basis and its grid of figures; the three navigation cards — Risk Assessment, Batch Compare, manual; and, at the foot, the scope warning: a screening tool, not a substitute for a full subnational debt sustainability analysis. Analyst's decision: none; it is orientation.
It is worth highlighting what this screen does well, because it is what §2.3 needs in order to be auditable: it declares its methodological basis and its count of threshold sets on the landing page, not in a footnote. A module that says up front which bands it rates against and how many regimes it knows is a module that can be argued with.
Limits.
Route: …/subnational_risk/assess. Input: three blocks. Output: the indicator table with value and band, the overall rating, the list of flags, and the report download. Analyst's decision: the whole of Step 1, the choice of threshold set in Step 2, and the reading of Step 4.
The three blocks of the form:
| Block | Fields | Step |
|---|---|---|
| Identity and rules | Entity name; seeded-entity selector; threshold set with the source of the chosen one on show | 0 and 2 |
| Budget and balance sheet | Total revenue · own revenue · operating expenditure · debt outstanding · annual debt service · contingent liabilities · liquid assets · short-term obligations | 1 |
| Current account and interest | Current revenue · current expenditure · interest expenditure (interest only) | 1 and 2 |
The third block has its own box and its own note, and the note is well written: it explains that current revenue less current expenditure is the balance the agencies publish and the current surplus one of the legal gates uses as a denominator; that together with interest it enables the two statutory gates; that if they are left at zero the screen falls back to the gross operating margin and reports the gates as not computable; and that interest expenditure is interest only, without amortisation. It is exactly what Step 1 (c) requires and it is the best-made part of the form.
The threshold set selector shows the chosen set with its full source underneath, and the result repeats the label of the set applied. That the source is on show at the moment of choosing, and not in an annex, is what makes Step 2 defensible.
Limits. Four, and the first bears on the most basic convention of the method.
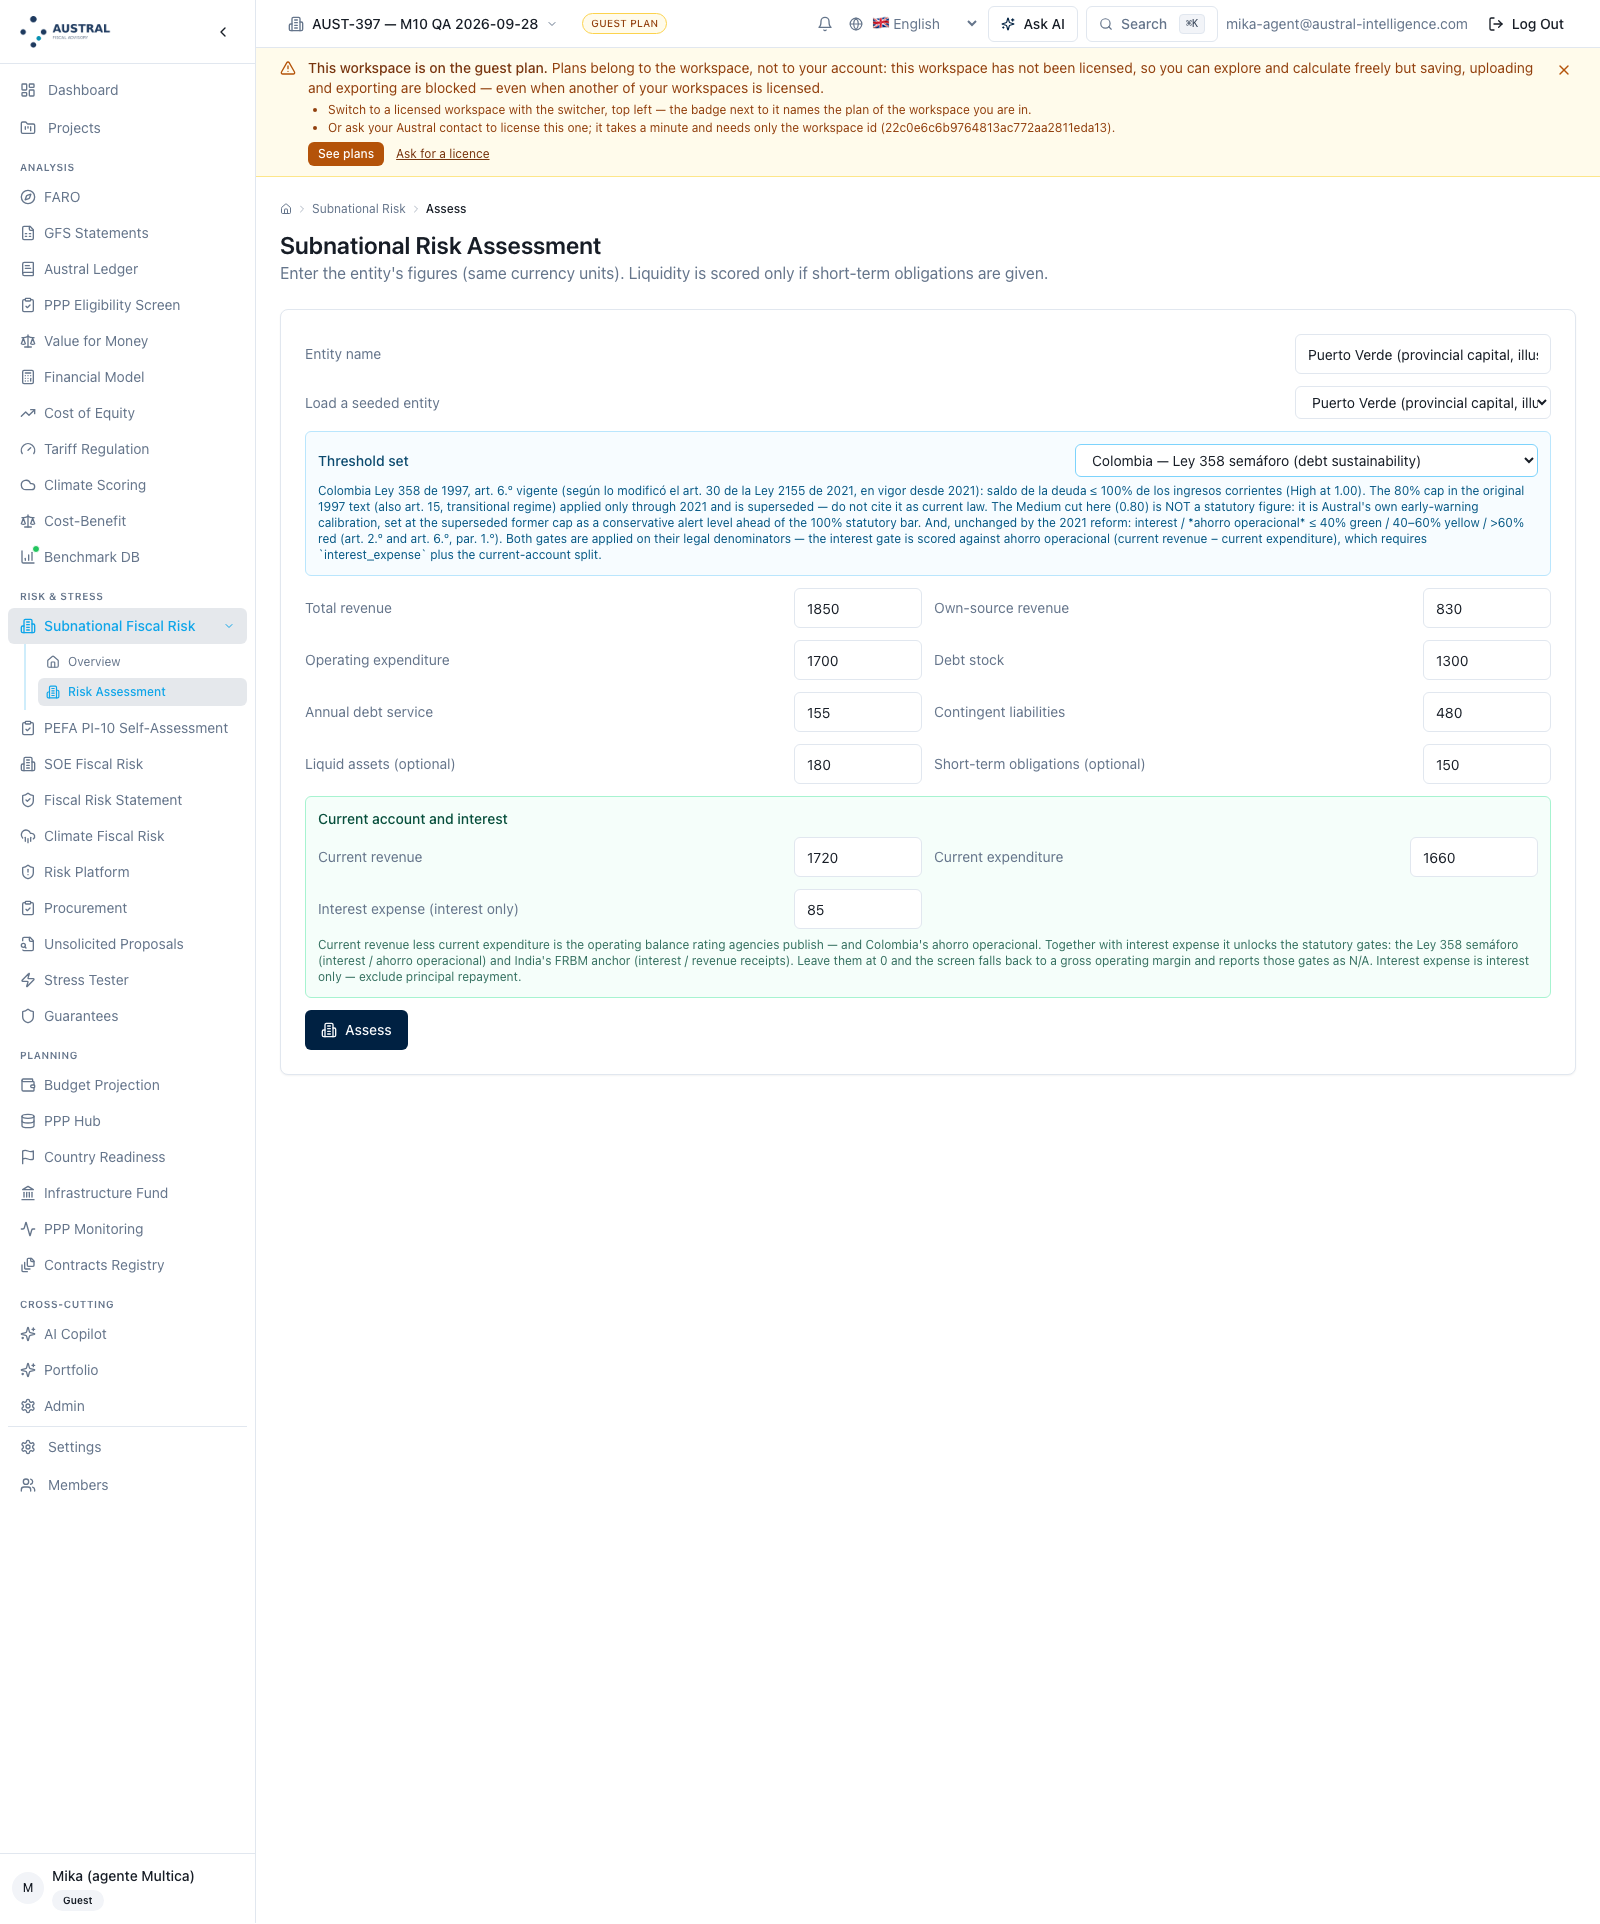
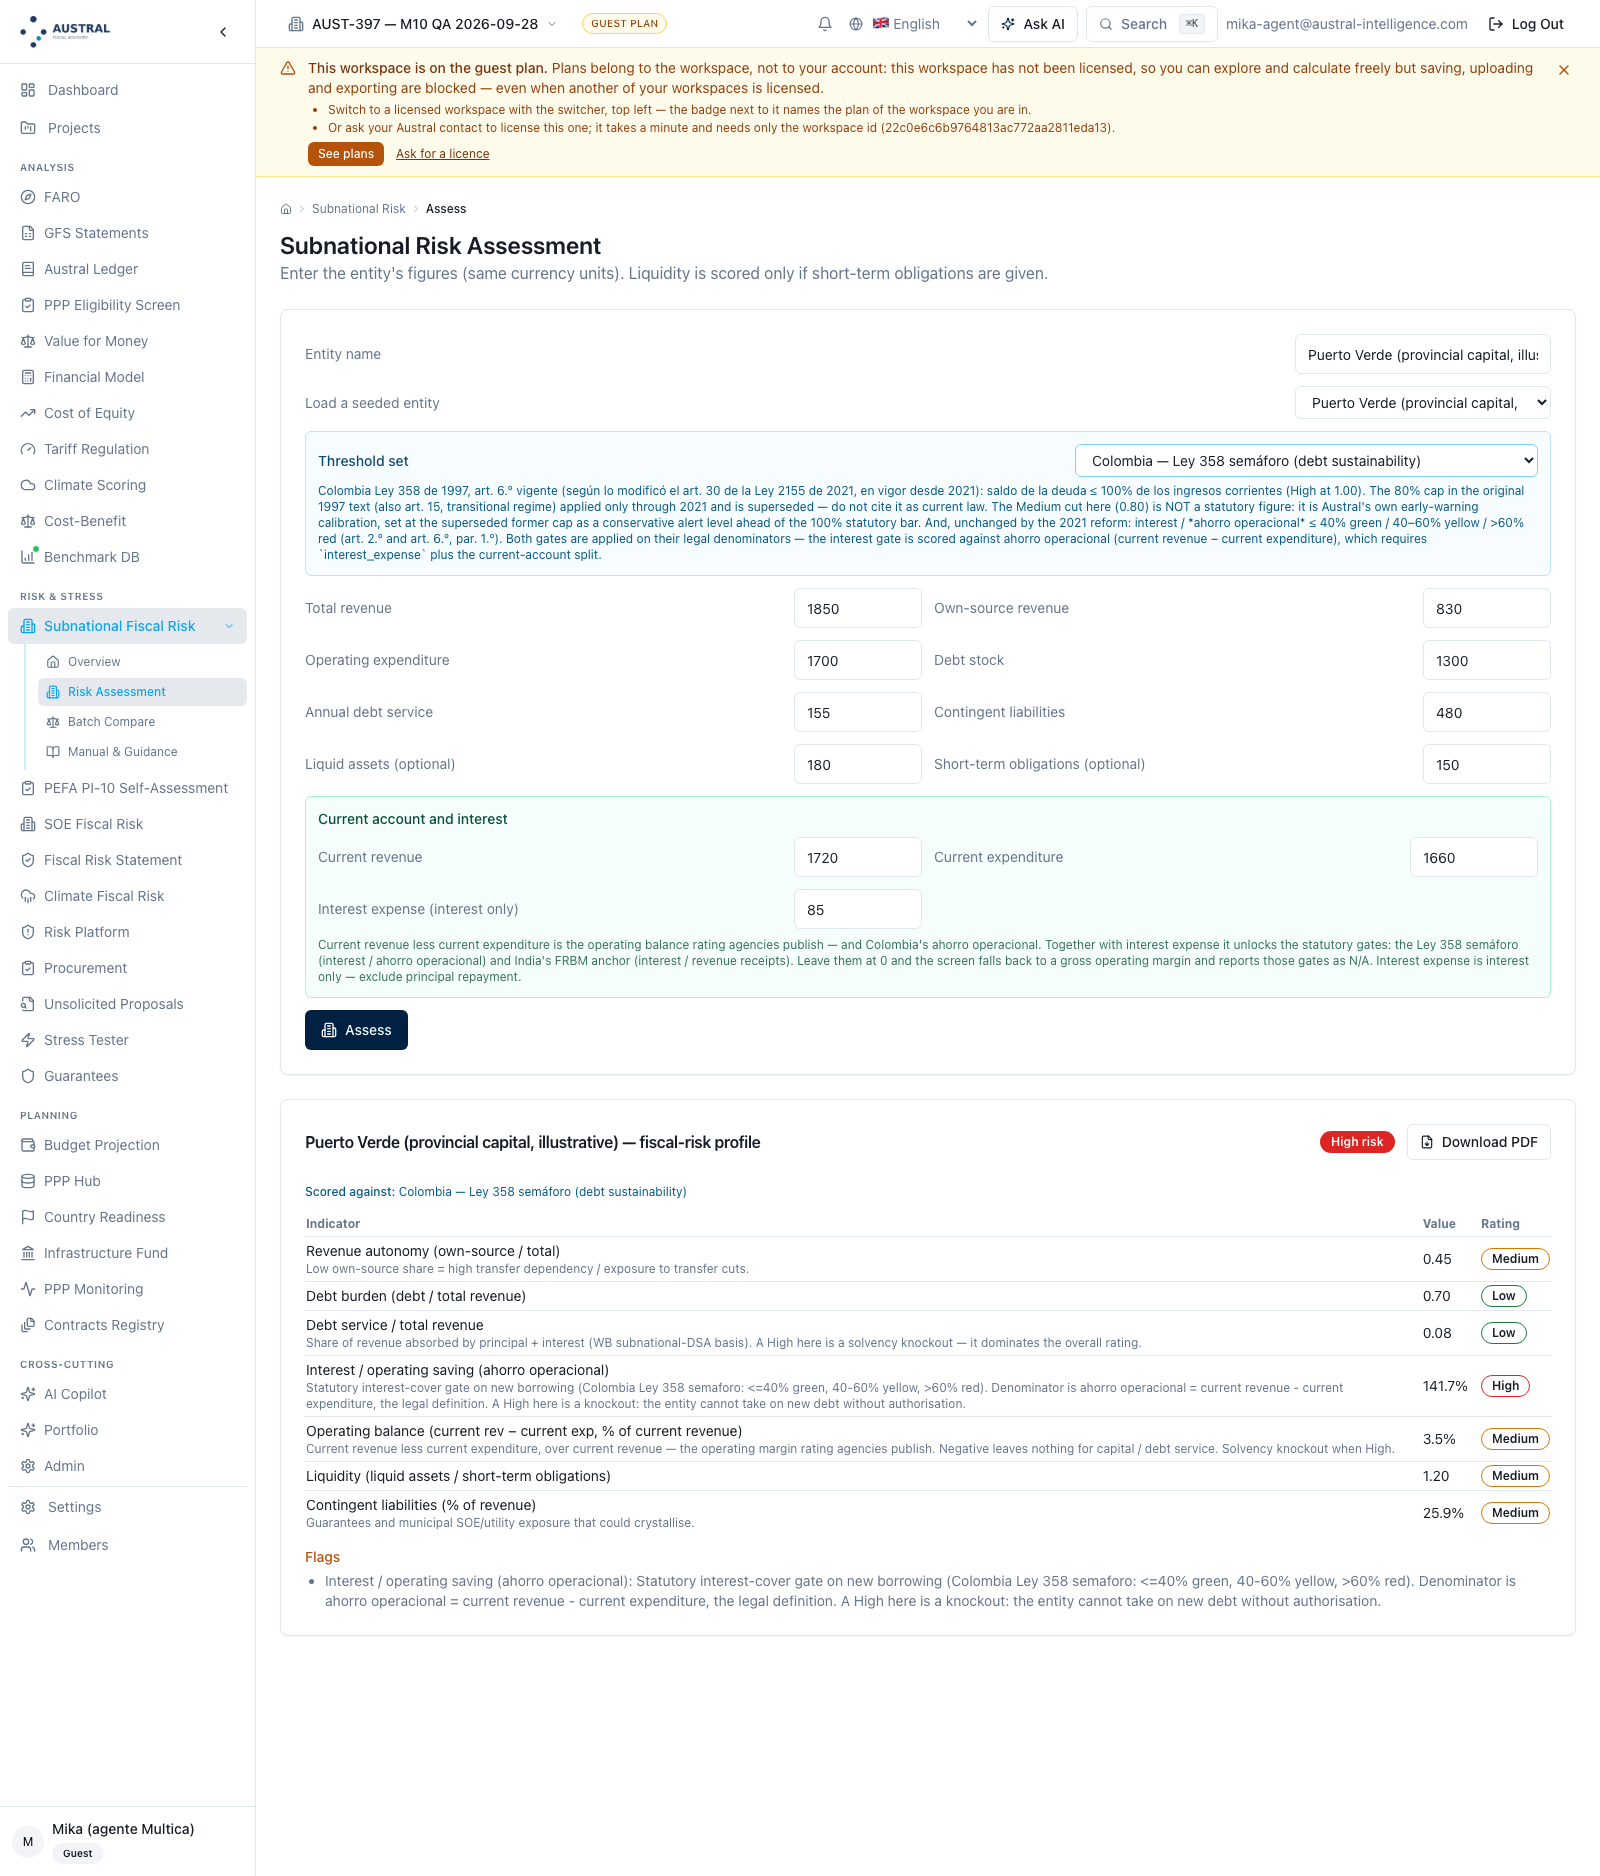
Route: …/subnational_risk/compare. Input: a table of entities, up to a hundred, with eleven numeric columns per row — the nine of the previous edition plus liquid assets and short-term obligations; the same threshold set selector, applied uniformly to all of them; and the button for loading the seeded entities. Output: the distribution by band; the list ordered worst risk first, with the rank, the name, the overall band and its flags, each row expandable to its full indicator table; plus a badge with the highest-risk entity. Analyst's decision: the composition of the portfolio and the common threshold set.
The screen does the essential part of Step 6 well: it applies a single threshold set and a single language to every entity, so that the comparison is between like and like, and it orders worst to best with the not-computable entity last. The tie-break criterion within a band is the Step 4 weighted average, which is the right quantity.
Limits. The three this section declared — and which degraded Step 6 in ways the analyst had to know about — are closed. They are left struck through because they are what the reader of the previous edition remembers.
And an absence that is not a defect but a hole: the comparison does not export. The risk scorecard report is per entity; the portfolio reading, which is the product a central unit uses, has no deliverable. In the meantime: it is obtained through the programmatic route of 5.6, or assembled out of N individual reports.
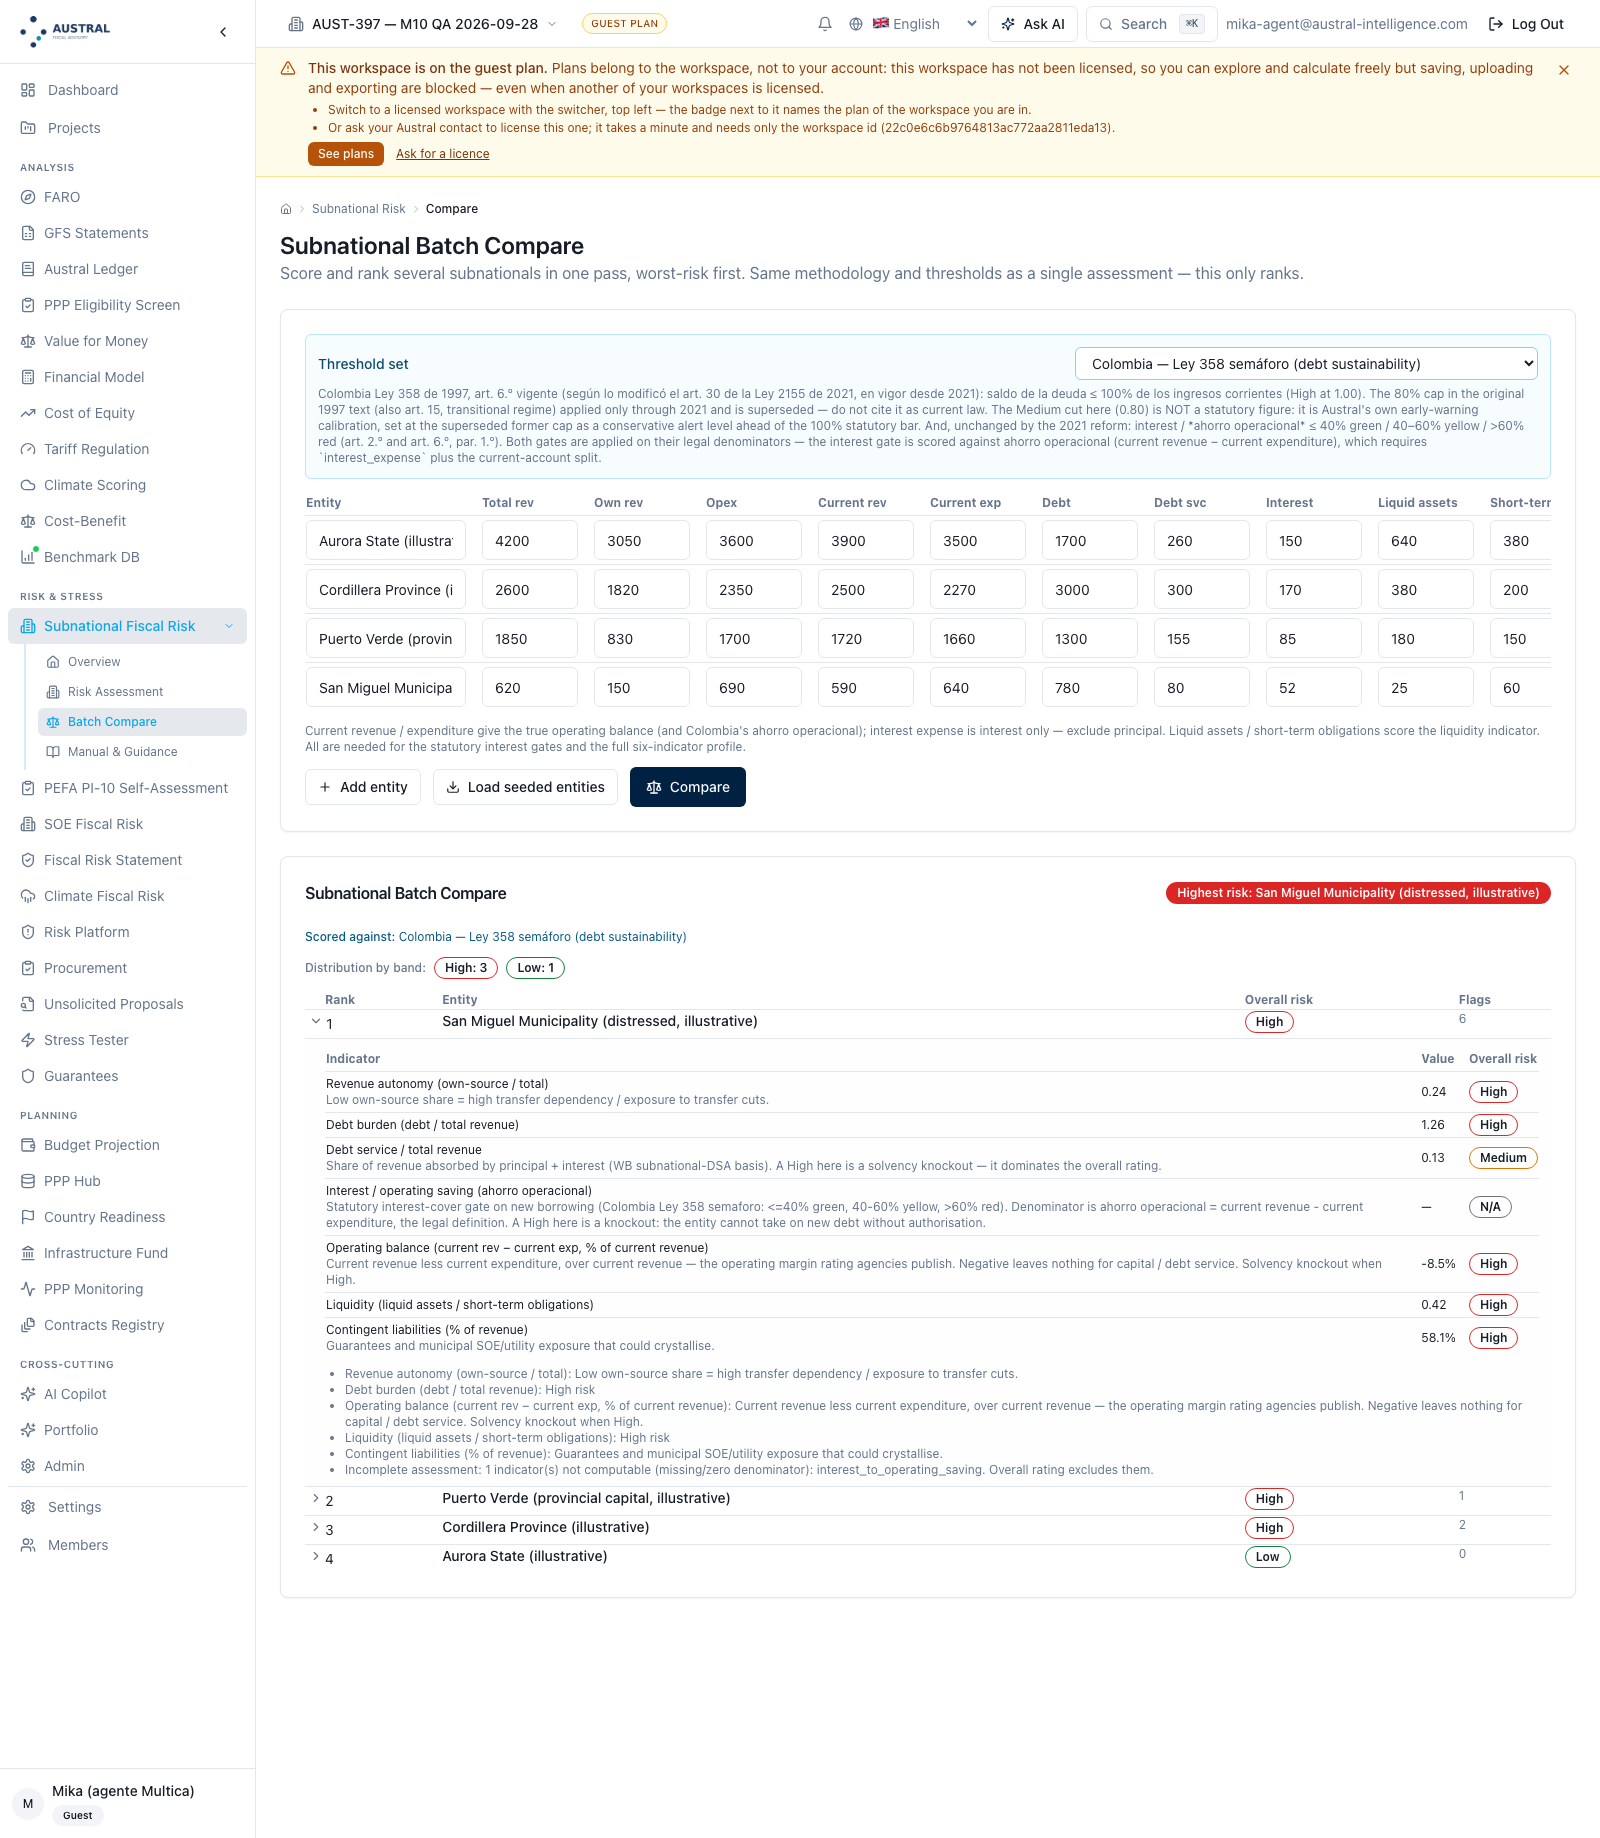
Route: …/subnational_risk/manual. Input: none. Output: the module's method in nine sections, in Spanish and English: the six indicators with their formula, their two cut-offs and their direction; the two design decisions — the denominator of the debt ratios, and the two versions of the operating balance; the cited threshold sets with their approximation warning; the two-stage roll-up with its weights; the not-computable rule; a worked example on the pack's municipality in difficulty; the demonstration pack; the methodological scope note; and the references.
It is a well-made piece and this manual is its extended version, not its replacement. Two sections are especially good and it is worth saying why: the one on design decisions, because it declares and argues the denominator convention instead of hiding it, which is exactly what §2.3 asks for; and the one on not computable, because it states the discipline of the method with the same clarity §3 states it.
Limits. Four were declared by this section; one is closed and three remain open, and they are of content.
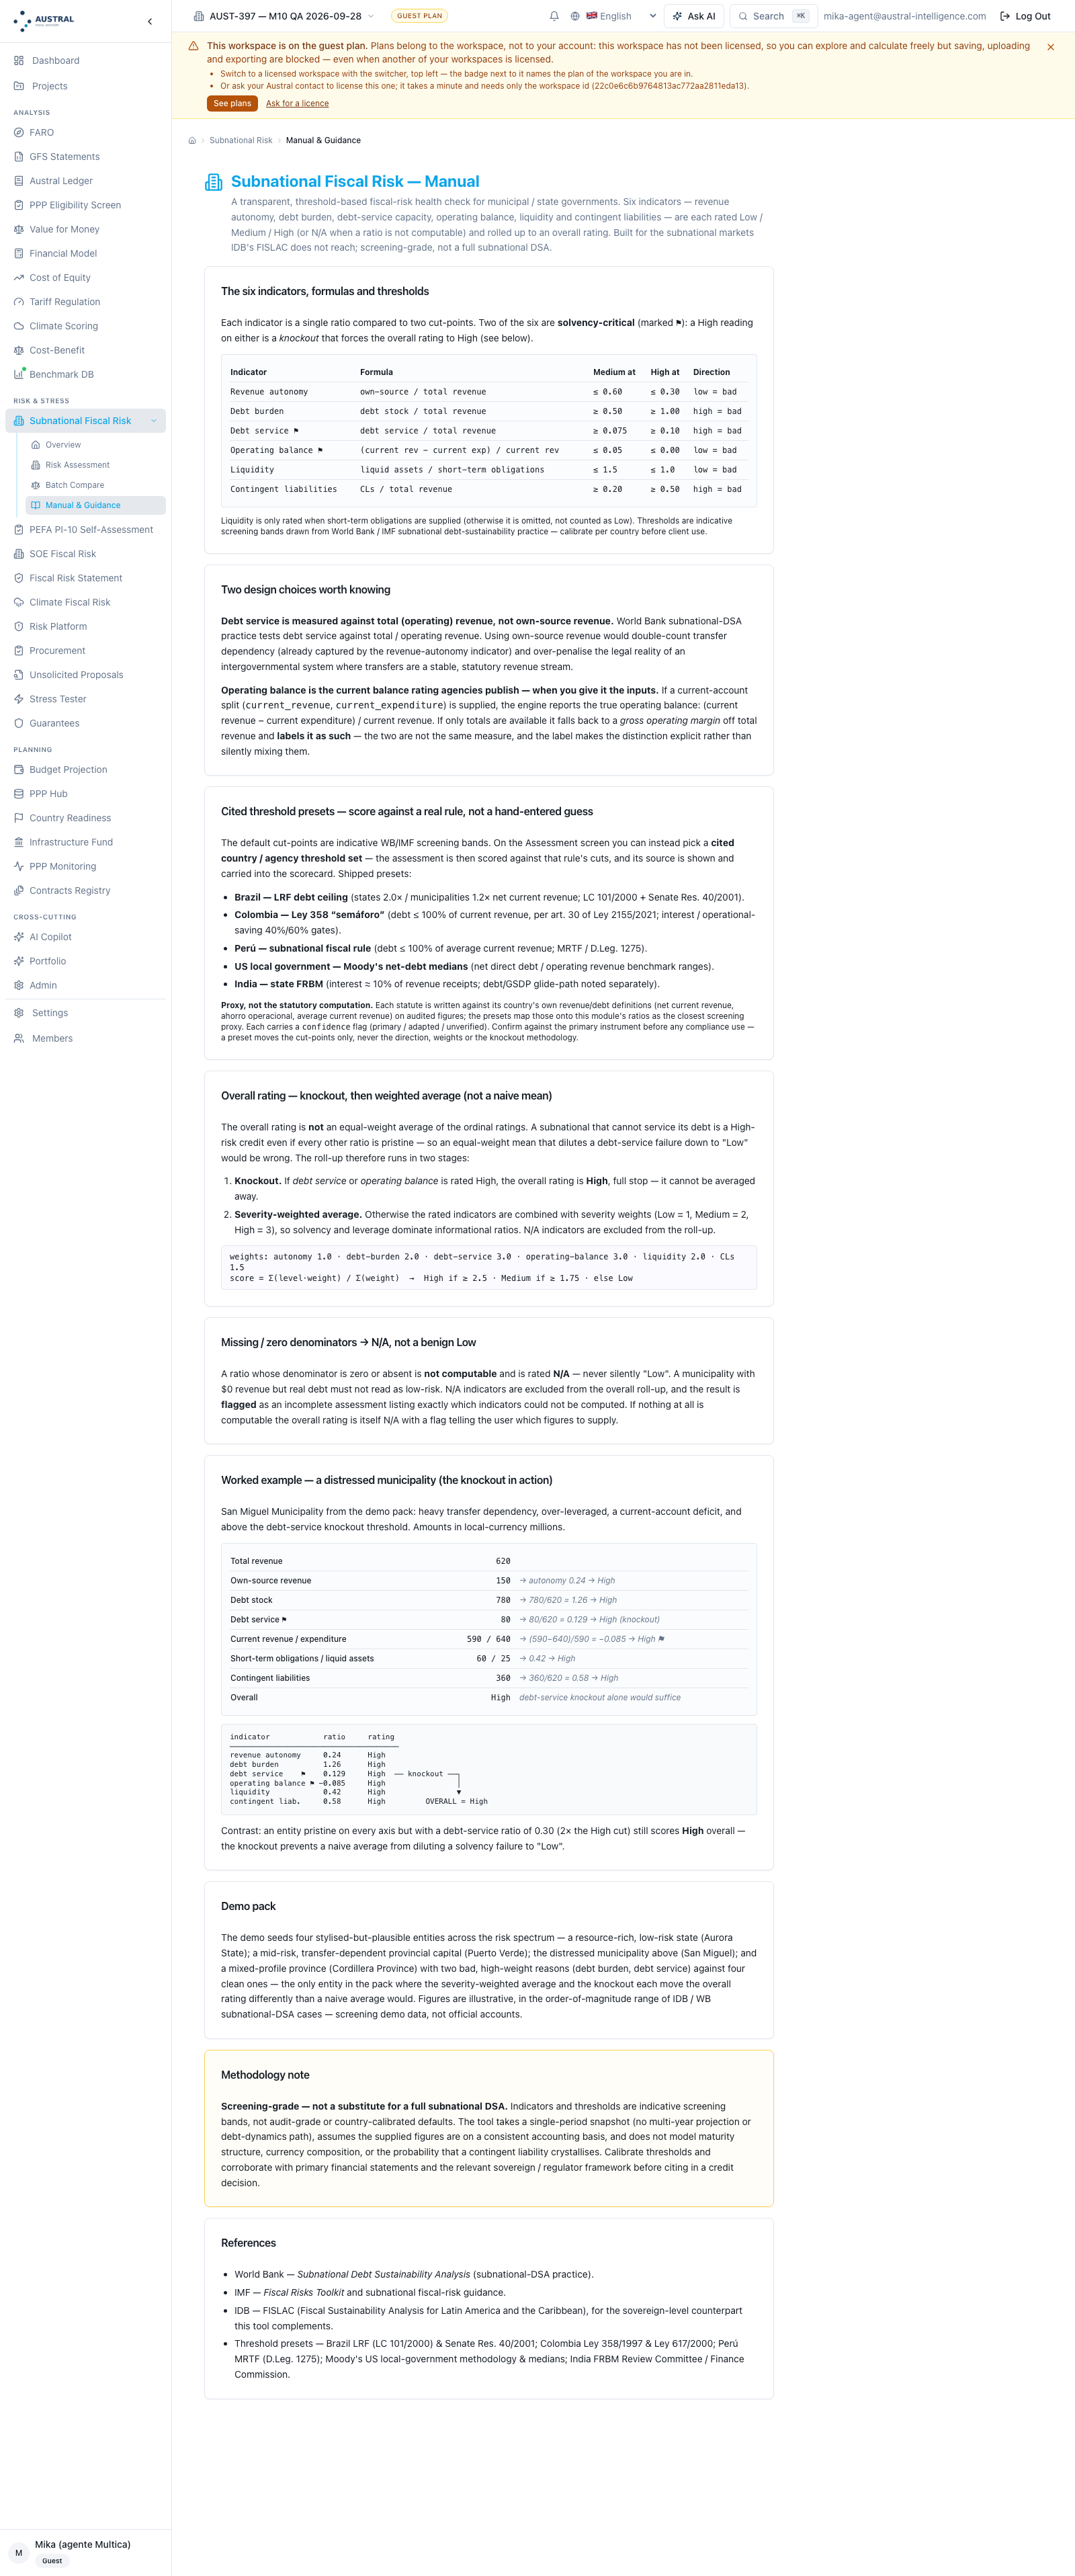
Routes: two exports of the same result, in PDF and in workbook. Input: the same twelve fields and the same threshold set as the assessment. Output: the deliverable a government takes to its council.
The PDF prints the generation date, the title, the entity, the overall rating with its colour, the threshold set applied with its full source, the indicator table with value, band, the two cut-offs and the direction, the flags, and the block of inputs that produced the score. The workbook prints the same plus the notes column, which is the one that explains what each indicator measures.
Limits. Five were declared by this section; three are closed, the fourth remains open and the fifth is half closed.
And a hole in access: the workbook has no button. The assessment screen offers the PDF download and nothing else; the spreadsheet export exists and is reachable only through the programmatic route. The offering page promises the client "the report in spreadsheet and PDF". [to be fixed]
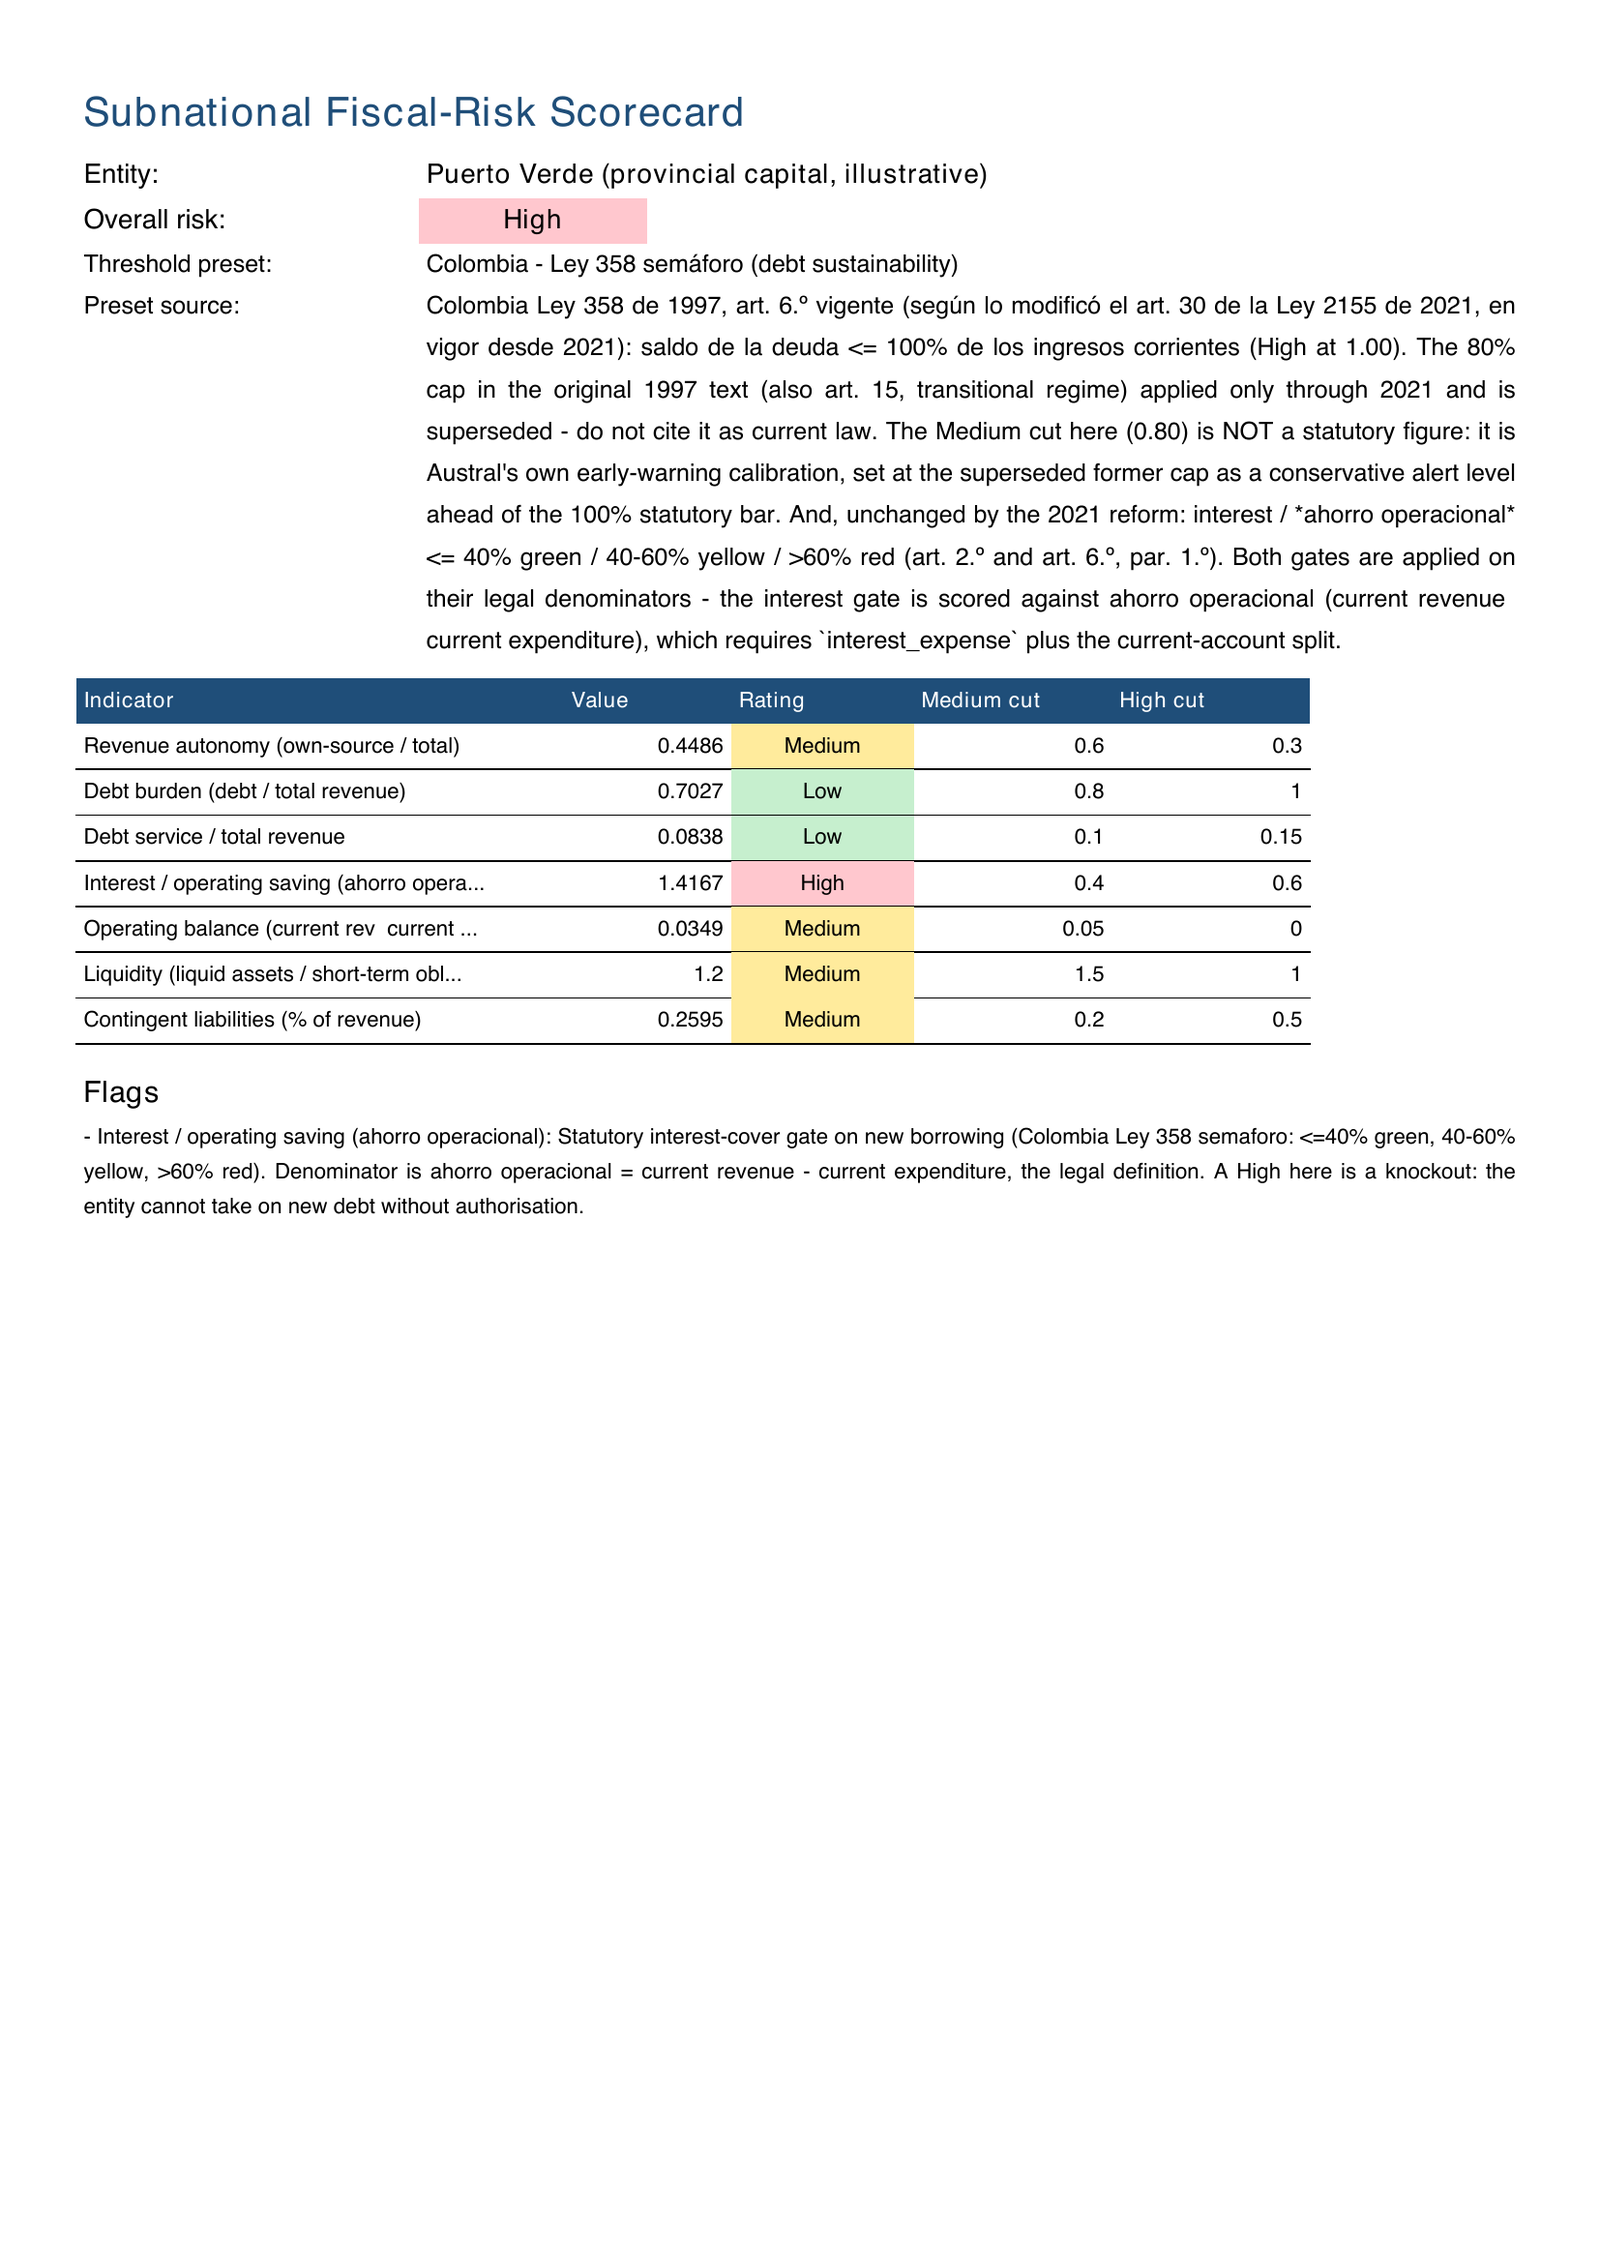
Figure 5.5 — pending a retake, and why. It is the only figure in this section that was not redone for this edition: four of the five limits its caption lists are closed — date, inputs, direction column and the minus sign — and the figure still shows the earlier state. The reason is one of access and not of product: the report is an export, and the platform blocks every export in an unlicensed workspace; the demonstration workspace these screenshots come from is born on the guest plan, so the new PDF could not be generated in the same workspace as the other figures. It will be redone as soon as that workspace is licensed.
The module publishes its default set in a browsable library, with the direction, the two cut-offs, the weight and the knockout mark of each indicator, and it accepts a preview of the cut-offs of any cited set before applying it. It is exactly what §2.3 needs in order to be auditable and it is a merit of the product: this module's cut-offs stopped being magic numbers inside the engine.
And it offers seven sets, each with its source and its confidence mark — direct, adapted, unverified or own: the default indicative set, two Brazilian ones (states and municipalities), a Colombian one, a Peruvian one, an Indian one, and an own calibration by this firm for high-income local governments. The first six cite an external source; the seventh does not, and for that reason carries a confidence mark distinct from the other three, with its reasoning written in the source field instead of a citation. Until recently the library carried, in that place, a set attributed to the published methodology of a rating agency, which was withdrawn: reproducing an agency's proprietary medians under this module's name is a question of licensing and trademark that this manual does not go into, and anyone needing to compare against a particular agency should go to that agency's published source.
This manual has five things to say about that mechanism, and three of them are warnings.
(1) A set moves only the cut-offs. Never the direction, never the weight, never the knockout rule. It is the right design decision: direction is a property of the indicator and not of the country.
(2) A set governs only the indicators its source regulates, and the result does not say so. Measured against the engine, indicator by indicator:
| Set | Confidence mark | Indicators it governs | Out of six |
|---|---|---|---|
| Default indicative set | direct | none (it is the base) | — |
| Brazil — states | adapted | debt burden | 1 |
| Brazil — municipalities | adapted | debt burden, debt service | 2 |
| Colombia | direct | debt burden, debt service, plus the interest gate it introduces | 2 + 1 |
| Peru | adapted | debt burden | 1 |
| High income — Austral calibration | own | debt burden, debt service | 2 |
| India | direct | only the interest gate it introduces | 0 + 1 |
The other indicators go on being rated against the default indicative bands, which are not those of the country whose name is on the label. Measured on the demonstration pack: under the Brazilian municipal set, the provincial capital goes from the medium band to the low one because the set rewrites the two cut-offs that entity improves on, while the other four indicators stay on the default bands. The report prints the Brazilian law's label and its source, and no surface says what that law governs and what it does not. The correction is one of presentation, not of engine: mark in the results table which cut-offs come from the set and which from the engine. [to be fixed]
(3) A set can loosen the cut-off of a knockout indicator, and that is still the gravest defect of this mechanism. Three of the seven sets move the debt service cut-off above the engine's 0.075 / 0.10: the Brazilian municipal one to 0.090 / 0.115, the Colombian one to 0.10 / 0.15, and the own high-income calibration to 0.08 / 0.12. None of the cited sources says anything about debt service measured against total revenue — the source text of the Colombian set cites the debt ceiling and the two interest gates, and the Brazilian one a debt ceiling. Measured against the engine with an entity whose debt service absorbs 11 % of its total revenue and whose other five ratios come out in the low band under all seven sets:
| Set applied | Debt service | Does the knockout fire? | Overall rating |
|---|---|---|---|
| Default bands | 0.11 → High | yes | High |
| Brazil — states · Peru · India | 0.11 → High | yes | High |
| Brazil — municipalities | 0.11 → Medium | no | Low |
| Colombia | 0.11 → Medium | no | Low |
| High income — Austral calibration | 0.11 → Medium | no | Low |
Two bands, in the benign direction, and with no warning. The cut-off that moves is that of the only indicator that can force the rating on its own, so the effect is not to lower a reading: it is to switch off a rule. And it is visible on the demonstration pack itself, not only on a test entity: the mixed-profile entity comes out High under six of the seven sets and Low under the high-income calibration, without passing through the intermediate band (§4.5). The correction: the cut-off of a knockout indicator is not moved by a set unless the rule itself sets it, and if it is moved, the result declares it. [to be fixed]
(4) The Colombian set's debt ceiling is now the one in force, and the correction is worth telling in full. Until recently the set published 0.60 / 0.80 and its source text asserted that the law sets debt outstanding at 80 % of current revenue — a ceiling that the article in force took to 100 % in 2021 (§2.4). Today the set publishes 0.80 / 1.00, with the 1.00 as the statutory figure and the 0.80 expressly declared as this firm's early warning and not as law, placed at the old ceiling. What made that a problem and not an oversight was the confidence mark: the set is marked as a direct statutory figure, and a set with the name of a law, marked as direct, publishing a superseded cut-off, is an audit problem even if it moves not a single band — and §4.3 measures that, on this pack, it moved none. The lesson of method remains: the confidence mark obliges a source text that says which part of the cut-off is the rule and which part is calibration. The Colombian set now says so; the others should be reviewed on the same criterion.
(5) A set that does not exist is returned and printed as though it had been applied. Faced with an unknown key, the merge returns the default bands unchanged — checked: the resulting set is identical field by field to the default one — and the response repeats the key received with the label and the source blank. The screen shows nothing, because it only prints the set when it has a label; the report does print it, with the non-existent key and an empty source, over cut-offs that are the default ones. A report a municipality takes to its council saying it was rated against a rule that was never applied is an audit problem, not an aesthetic one. [to be fixed]
And a note on the confidence marks, which today do not order what they ought to order. The default indicative set — which the module itself describes as screening bands and not as a legal limit — is marked direct, while the Brazilian debt ceiling and the Peruvian rule, which are real legal ceilings mapped onto another denominator, are marked adapted. And since the selector hides the mark when the set is marked direct, the result is the worst of both worlds: the default set, which is the firm's calibration, is shown with no mark at all, and the faithfully cited Brazilian ceiling is shown with the warning. The mark added for the own high-income calibration — own, distinct from the other three — is the right way to resolve it and the pattern the others should follow; what is missing is for the selector to always show the mark, above all when it is "direct". [to be fixed]
The indicator labels come back translated from the engine, and so do the explanatory notes for each indicator. The Low / Medium / High bands and the indicator keys are not translated, by declared design, and this manual respects that decision: they are the product's taxonomy and the reader has to see the same word in the manual and on the screen.
Two defects were declared by this section. The first remains open and is noticeable on a first reading in Spanish; the second is closed.
Two indicators out of six have no note in any language. Debt burden and liquidity have no explanatory text, in Spanish or in English. Since the list of flags is built from the indicator's name and its note, and an empty note falls back to a reserve literal in English, an otherwise translated response contains phrases such as "Carga de deuda (deuda / ingresos totales): High risk" and "Liquidez (activos líquidos / obligaciones de corto plazo): High risk". It is visible on the demonstration pack itself: the municipality in difficulty is in the high band on all six indicators, and two of its six flags come out in English. The bands are taxonomy and it is right that they are not translated; the phrase "High risk" is not taxonomy, it is prose. [to be fixed]
~~The statutory gates are displayed as a ratio, not as a percentage.~~ — closed. The law speaks in percentages — 40 %, 60 %, 100 % — and the screen now prints the percentage: the gate of the pack's provincial capital reads 141.7 % of the current surplus, which is what it is — a legal prohibition — where the previous edition showed 1.42 next to cut-offs of 0.40 and 0.60. The same formatting rule holds on the comparison screen, which shares it with the assessment one instead of having its own. This manual reports the gates as percentages throughout its pages, and the product now does the same.
Three engine conventions with their measured effect, and all three matter because they are the ones a user does not guess.
(1) The operating balance changes definition depending on whether the current split is supplied — and the screen says so. With the two current fields, the indicator is the current balance: current revenue less current expenditure, over current revenue. Without them, it is a gross operating margin over total revenue, and the engine changes the indicator's label to say so, besides explaining it in its note. It is the right way to handle a degradation of measure and it has to be acknowledged: the product does not mix two measures under one name. What the manual adds is the consequence the label does not convey: the two measures are compared against the same cut-off and they should not be, because the gross margin has capital revenue at both ends.
(2) The liquidity indicator disappears if there are no short-term obligations. It is not declared not computable, it does not enter the incomplete-assessment flag and it is not deducted from the coverage: it simply is not there. Measured on the same entity: with no short-term obligations, five indicators, zero flags, low band; with a liquidity of 0.50, six indicators, one flag, medium band. Supplying the datum worsened the profile, and the version with less information carried no signal. It is the only one of the six indicators that skips the discipline the engine itself declares in its documentation and applies to the other five. And it is what makes the difference between the two screens invisible (§5.1). [to be fixed]
(3) The statutory gates exist only if the threshold set introduces them. They are not diagnostic indicators: the engine adds them when the chosen set defines them, and it does not evaluate them in any other case. The consequence is that the same entity has six, seven or eight scored ratios depending on the set chosen, and the number of rows in the table changes with nothing to explain it. The design decision is right — a gate the entity's jurisdiction does not have is not applied to it — and what is missing is saying so: the landing page publishes "six" (§5.1) and the on-screen manual lists six.
And a fourth, which is the one Step 2.3 of the method discusses: when the current surplus is zero or negative, the interest gate comes back not computable and is excluded from the roll-up. Measured on the demonstration pack: the municipality in difficulty, with a negative current surplus, gets not computable on the most consequential legal test that can be applied to it. It still comes out in the high band because of the other knockouts, but for the wrong reason. And there is a second-order effect worth seeing alongside: under the Colombian set, that same municipality also loses the debt service knockout, because the set loosens that cut-off (§5.2). Of the three tests that should condemn it, two fall silent under the regime that carries the name of its law, and the high band rests on the third alone. [to be fixed]
Here the manual has to be frank: today there is no hand-off. The diagnosed portfolio does not enter the consolidated fiscal risk register, it does not talk to the portfolio consolidation of the monitoring module or to the workspace's subnational mode, and the three surfaces use different entity models.
The platform today has four subnational surfaces:
What this manual has to declare, because a manual cannot teach two opposite answers from the same product to the same question: surface (1) and surface (3) answer the most consequential question in the domain in opposite ways. The diagnostic engine measures debt against total revenue and gives its reasons — measuring against own revenue would double-count transfer dependence, which the autonomy indicator already measures, and would over-penalise the legal reality of an intergovernmental system (§2.3); the capacity calculator measures against own revenue. Both are in the same product, for the same client, in the same session.
The manual takes the engine's convention, for the three reasons of §2.3, and leaves the capacity calculator outside the method — not because of the divergence of convention, which would be arguable, but because of a defect that invalidates it arithmetically. In that calculator, the leverage parameter has no effect: debt capacity is obtained by multiplying own revenue by the parameter, and own revenue is obtained by dividing the investment ceiling by that same parameter, so that the parameter cancels out. Checked with five values of the parameter on the same profile: the revenue displayed changes and the debt capacity, the per-capita capacity and the affordability band are identical in all five cases, while the response comments on the chosen parameter as though it had done something. There are besides two minor problems in the same block: the annual revenue is not an input but an artefact solved back from the investment ceiling, and the affordability bands are per-capita figures with no currency applied to any currency. [to be fixed], and it is the cheapest defect to repair and the most expensive to leave, because it is a client-facing screen returning a number that looks calibrated.
Surface (2) is named once as a neighbouring surface and not as part of the method, until the entity model converges. What it contributes and the diagnostic does not have is real: a ceiling per entity, headroom and population. And the two are in different languages: the monitoring consolidation and the subnational mode are in English only, while the diagnostic module is translated. [to be fixed]
And the rule of non-duplication with the other manuals in the series, which is the one in Step 0 (d) and is repeated here because this is where it is operated: this manual publishes the guarantee's stock; the instrument's manual publishes its expected cost; the consolidated register takes one of each. When an entity has a material utility company, both manuals are run: this one names it in the perimeter and records it as a contingent liability, that one diagnoses it.
[to be built]: an adapter that produces the subnational row of the consolidated register, a single entity model for the four surfaces, and the correction of the calculator's defect.
The individual assessment, Batch Compare, the threshold library, the cited-sets library and the two report exports are all callable with the account's session. It is the route by which what the interface still does not give is obtained today: the report as a spreadsheet, which has no button.
The call a central unit would use to screen its whole portfolio is the Batch Compare one: the list of entities is sent — up to a hundred, each with its twelve inputs — along with the common threshold set and the language, and it returns the entities ordered worst risk first, each with its complete indicators, its band and its flags, plus the summary with the count per band and the worst entity. What this section noted here — that the programmatic response brought back more than the screen showed — is no longer true: the indicator values and the distribution by band have been on the screen too since 28-09 (§5.1). The programmatic route stops being the only way to the complete Step 6 and becomes what it should be: the way to screen a whole portfolio without going through the screen.
The threshold library accepts a preview of a set's cut-offs without applying it, which is how the table in §5.2 (2) is produced and how what each set governs is audited before it is used.
Before the list, the limit that governs them all: the module takes one period and not a series. It is declared here and not at the end because it is not one more shortfall in the table: it is the one that most separates what the module delivers from what §3 asks for. Subnational solvency is a trajectory — a current balance that narrows three years running says more than its level in one; a stock of accrued unpaid expenditure that grows says more than its ratio over revenue; a bunched maturity profile is not visible in the year's debt service — and none of those three readings can be produced with this module. Everything it publishes, and everything §4 shows, is a snapshot of one financial year.
What the analyst does in the meantime is in the table: run one assessment per financial year and compare the outputs by hand. What needs to be built is in §3 Step 1.2 — change and direction by indicator, trend band with a declared rule, and the Step 9 reconciliation between two runs by its four causes — and it is work for the second edition of this manual, not for this one. This edition is published with the single period declared as a limit in every place where a figure rests on it.
The live list, at the close of this edition, with what the analyst does in the meantime in each case.
| What is missing | Step | What the analyst does in the meantime |
|---|---|---|
| Perimeter block | 0 | Writes the Step 0 page outside the tool and attaches it to the report |
| Fiscal cost and central-level exposure | 7 | Builds the four channels in a spreadsheet, with the central level's registers |
| Hand-off to the consolidated register | 8 | Writes the row by hand, with the fields and the tail law of Step 8.2 |
| Accrued and unpaid obligations | 1, 5 | Measures them outside and declares them separately; does not add them to the contingent liabilities field |
| Breakdown of contingent liabilities by family | 5 | Keeps the contingent liabilities sheet outside and writes only its total in the aggregate field |
| Multi-year history and projection (the module's largest limit) | 1, 3, 6 | Runs one assessment per financial year and compares the outputs by hand |
| Maximum future debt service | 3 | Computes the ratio with maximum service where there is grace or bunched maturities |
| Identity validation | 1 | Checks the five identities in the input spreadsheet before going in |
| Regime with no ordinary borrowing | 2 | Declares the gate not applicable and discards by hand the two debt indicators |
| Population and per-capita figures | 6 | Computes them outside; the neighbouring surface has them and does not talk |
| Scope warning in the report | 9 | Attaches the perimeter page to every report; the date and the inputs the report now carries itself |
| Versions of the register | 9 | Files the exports with their date and their threshold set |
Off the list — and it is worth saying, because an earlier edition's limits list is what the reader remembers — are today: the comparison's two liquidity fields, the indicators and the distribution by band on the portfolio screen, the report's date and inputs, its direction column, the PDF's minus sign, the Colombian ceiling in force in the on-screen manual, the statutory gates as percentages and the two screens the navigation was missing. Ten corrections this section asked for, closed in production on 28-09-2026, that is, after this section declared them. Two of the same group remain open: the PDF's notes column and the scope warning on both deliverables. A manual of a living platform is written against a moving target, and the rule of the series is to say so with a date rather than to disguise it.
The module is the first gate of the firm's subnational public-private partnership programme: the fiscal diagnostic of the government itself goes before the eligibility screening of the projects and before any public sector comparator. The order is that of §1.4 and it is not one of convenience: an excellent project in a government that cannot sustain a multi-year commitment is a fiscal problem with a good technical appraisal.
And here there is a coherence correction this manual is obliged to point out, because the three surfaces that declare a methodological basis declare three different things. The programme page presents as the basis of its first step the city creditworthiness initiative of a multilateral bank, "together with the subnational debt sustainability literature", and says the step operationalises it. The module's on-screen manual does not mention it: it declares subnational debt sustainability analysis, the Fund's fiscal risk toolkit, the development bank's regional tool and the legal instruments of its sets. And §2.5 of this manual verified what that initiative actually publishes: a qualitative self-assessment questionnaire that derives creditworthiness challenges with an intensity, with an action plan as its output. It does not compute financial ratios. To say that an engine of six ratios operationalises it is, at best, imprecise.
This manual's position is that of §2.5: the declared basis of the method is the Fund's note, the OECD framework and the statutory and subnational debt sustainability practice, which is what the engine actually implements; and that initiative's qualitative layer of environment and practices — which is real and is precisely the half this method does not cover — remains a declared product roadmap item, not a foundation. The offering, the on-screen manual and this manual have to say the same thing, and today they do not. [to be fixed]
There is besides a positioning tension in the same family worth resolving at the same time: the module declares on its landing page that it is aimed at the markets the development bank's regional tool does not reach, while the programme page sells it to the countries that are precisely that tool's territory. Both sentences can be true at once — the module serves both markets for different reasons — but not put like that. [to be fixed]
The screenshots of this section are from the demonstration workspace with the four-entity pack, and they can all be reproduced: the pack is loaded, the entity is chosen in the selector, the threshold set is chosen and the assessment is run. It is the same portfolio §4 walks through step by step, so that whoever reads the example can see it on screen and whoever looks at the screenshots can read its arithmetic.
And the note that closes §5 in every manual of this series, which here has a condition worth writing down. The client keeps the tool and the capacity to operate it: the workspace with its data, the threshold sets applied with their source, and the reports. What this manual adds is that four of the method's ten steps are executed outside the tool today, and the transfer of capacity includes that: the perimeter page, the contingent liabilities sheet, the four-channel spreadsheet and the consolidated register row are part of the practice that is transferred, with their template, until the product absorbs them. A team that keeps the tool and not those four pieces keeps six steps out of ten.
One has to begin with a concession, and it is not a courtesy. Almost every territorial finance unit in the world works in a spreadsheet, and does it well. To diagnose one entity — open its statements, separate the current account, compute six ratios, look at the result against a cut-off — a spreadsheet is not merely adequate: it is probably the best tool there is, because it lets the arithmetic be seen and because the analyst can improvise the row that is missing. This manual is not written against the spreadsheet.
The argument of this section is narrower and more concrete: what happens to a spreadsheet when it stops being an instrument of analysis and becomes a register. An annual subnational register — Lemuria's has 42 entities, and that of a medium-sized country in the region has several hundred — has records arriving from as many sets of accounts as there are entities, two or three different legal regimes applying to different rows of the same table, thresholds that change when they are calibrated to the country, a reporting chain that ends in a signed budget document, and a reviewer who in three years' time is going to ask where a figure came from. None of those five things is a computation problem. All of them are problems of provenance, invariants, coverage and versions, and none of them is solved with a better formula.
The nine failures that follow are not hypothetical. Each one is presented the same way: where it occurs (which step of §3), what fails in the spreadsheet, how much it costs measured on Lemuria's portfolio from §4, and what the tool does in its place. And something has to be said before starting, because it is what gives the rest its credibility: several of these failures happened to the tool itself, and two of them remain open as at this edition's closing date. They are told that way on purpose. The difference between a spreadsheet and a program is not that the program does not make mistakes: it is that when it does, it is written down where, it is corrected once for all 42 entities, and the following year it can be demonstrated that it was corrected.
Where it occurs. Step 1 in the loading, Step 6 in the reading. It is the failure that organises all the others.
What fails in the spreadsheet. The spreadsheet orders the entities by their stock of bank credit and publishes that list as an order of risk. It is the most natural operation in the world: financial debt is written in a contract, it has an amount, it has a creditor, and somebody reports it quarterly. Everything else — accrued expenditure left unpaid, the deficit of the transferred service, the guarantee the entity granted — has no single contract and no single report, and so has no column.
How much it costs in Lemuria. The order by stock of debt is the exactly inverted permutation of the method's order:
| Rank | The method's order | Band | Order by stock of debt | Stock |
|---|---|---|---|---|
| 1 | San Miguel | High | Aurora | 1,700 |
| 2 | Puerto Verde | Medium | Puerto Verde | 1,300 |
| 3 | Aurora | Low | San Miguel | 780 |
The entity the spreadsheet puts first on its risk list is the one the method puts last, and the one the spreadsheet declares healthiest is the insolvent one. It is not a coincidence of this portfolio. The stock of debt of a subnational government is, to a first approximation, proportional to its capacity to borrow — and therefore to its solvency, its own tax base and its access to credit. Ordering by debt is ordering by access to credit, and access to credit is the opposite of fiscal risk.
The extreme case is in §4.7 and it is worth bringing here because it is the one that happens to a whole country: in a jurisdiction that prohibits ordinary municipal borrowing, the debt column of every entity in the register is a column of zeros, the list comes out flat, and first place for good health goes to the entity that owes its suppliers 4.55 months of current expenditure. With that entity added to Lemuria's portfolio, the method puts it second of four and the stock of debt puts it last, with the best possible record.
And the error has a version of the opposite sign, which is the over-correction. When somebody realises the above, the natural reaction is to add everything into a single "total debt" column:
| Entity | Debt | + contingent liabilities | + accrued and unpaid | "Total debt" | Over revenue | Band it would give | Real band |
|---|---|---|---|---|---|---|---|
| Aurora | 1,700 | 590 | 120 | 2,410 | 0.5738 | Medium | 0.4048 Low |
| Puerto Verde | 1,300 | 480 | 95 | 1,875 | 1.0135 | High | 0.7027 Medium |
| San Miguel | 780 | 360 | 48 | 1,188 | 1.9161 | High | 1.2581 High |
Two of the three entities worsen by a whole band and none improves. Overstating is not the prudent option it looks like: it flattens the portfolio's order, which is the only thing a ministry can use, and it treats alike a guarantee that may never be called, an invoice due next month and a bond with a half-yearly coupon.
What the tool does. The three classes of obligation live in different fields and no calculation adds them: financial debt has its ratio over revenue, contingent liabilities have theirs, and the two are published separately with their label. The tool does two thirds of this well and the missing third is declared: it has no field for accrued and unpaid obligations, so that in a jurisdiction where that is the dominant obligation the register either loads it into the short-term obligations field and says so, or does not load it at all. The method asks for the field; the manual says how to work until it exists.
Where it occurs. Step 1, in the loading. It shows up in Step 3.
What fails in the spreadsheet. One cell. The own revenue line adds own revenue and the transfer together, because in the budget execution statement they come one below the other, because both are genuine revenue, and because in everyday conversation "what comes into the municipality" includes both. It is an error that produces no signal: total revenue comes out right, the execution ties, the year's result does not change.
How much it costs in Lemuria.
| Entity | Correct autonomy | Band | Autonomy with the error | Band | Indicators in High | Flags |
|---|---|---|---|---|---|---|
| Aurora | 0.7262 | Low | 1.0000 | Low | 0 → 0 | 0 → 0 |
| Puerto Verde | 0.4486 | Medium | 1.0000 | Low | 0 → 0 | 0 → 0 |
| San Miguel | 0.2419 | High | 1.0000 | Low | 6 → 5 | 6 → 5 |
The result has to be read slowly, because it is less spectacular and graver than the simple version of the argument. No overall rating moves: revenue autonomy is the lowest-weighted indicator in the set — 1.0 out of a total of 12.5 — and the other five ratios hold up the verdict. What the error does is switch off exactly the signal that should have switched on. San Miguel, a municipality that funds 76 % of its budget out of transfers, declares perfect autonomy, loses one of its six indicators in the high band and loses the corresponding flag.
Three things make this error particularly dangerous. The first is its constant direction: an entity wholly dependent on transfers can never come out badly on autonomy if transfers count as own revenue. The second is its fingerprint, which is what makes it detectable: the three entities give exactly 1.0000, because in all three the identity ties. An indicator that returns the same number for three very different entities is not measuring anything, and that is the symptom to look for in a register of 42 rows — an autonomy column full of ones. And the third is that the error does not appear where it is committed: it is committed in the loading and it shows up three steps later, in a flag that did not come out.
What the tool does. The separation is in the input form and not in the formula: own revenue and transfers are two different fields that are never in the same cell, and no calculation can confuse them because they never share a space. The correction does not consist of warning the analyst about the formula; it consists of not giving them the opportunity to write it wrongly. What the tool still does not do is check the identity — own revenue plus transfers against the total — which is the second half of the guard and the subject of the next subsection.
Where it occurs. Step 1, in the loading. The damage appears where one least expects it.
What fails in the spreadsheet. The spreadsheet has no concept of an "impossible datum". It has cells, and a cell with 1,500 where there should have been 150 is a cell with a number. The three identities a subnational budget always satisfies — own revenue plus transfers equals total revenue; current revenue no greater than the total; the two legs of the current-account split present or absent together — are written nowhere, so nothing verifies them.
How much it costs in Lemuria. The three entities of the portfolio satisfy the identity: own revenue plus transfers ties exactly with the total in all three. That is what should happen, and that is why the cost has to be measured on constructed cases, which is how any guard is measured.
An entity loaded with own revenue of 1,500 and total revenue of 1,000 returns:
| Result | Value |
|---|---|
| Revenue autonomy | 1.5000 |
| Band of that indicator | Low — that is, excellent |
| Overall rating | Low |
| Flags | 0 |
| Identity own revenue + transfers against the total | fails by 800 |
A ratio that is a share and is worth 1.5 is not an extreme value: it is an impossible datum, and the difference between those two things is precisely what an input validation exists to say. The entity comes out of the screen with the best rating on the scale and without a word.
And the variant that is worse than the error, because it punishes whoever half-reports. An entity that supplies current expenditure without current revenue leaves the operating balance not computable, with an incomplete-assessment flag and a coverage of 5 of 6, when the other two fields it did bring — total revenue and operating expenditure — would allow the gross operating margin to be computed. With the second leg supplied, the balance comes out at +0.0500, band Medium, coverage 6 of 6, zero flags. In both cases the overall rating is Low; in the first the diagnostic is published incomplete for want of a datum that was on the table.
What the tool does. Today, almost nothing: it validates that each field is non-negative and nothing more. It is the failure in this chapter where the tool cannot present itself as the correction, and the manual says so instead of implying otherwise. What the method asks for, and which is a change of validation and not of engine: the three identities as a soft input alert — one that does not block the loading, because there are legitimate redefinitions, but that forces an acknowledgement — and the fall-back to the gross operating margin when a leg of the split is missing, with its label. Until that exists, the check is a row of the exercise's input table: the fourth row of table 4.2 in §4 is there for this reason, and a register of 42 entities needs that row 42 times.
Where it occurs. Steps 3 and 4. It is the most expensive of the nine failures and the one the method regards as its most important rule.
What fails in the spreadsheet. A missing datum has two possible destinations in a spreadsheet, and both are wrong. If the cell is left at zero, the indicator is computed with a zero and the entity is unfairly lowered: zero liquid assets is zero liquidity, which is the high band, when what has happened is that nobody reported the cash. If the cell is left empty, the formula returns an error or — worse — the row is dropped from the average, and the entity rises: it has one ratio fewer, all the ones it has left are good, and its rating improves through not having reported.
Of the two, the second is the grave one, because its direction rewards opacity. And it is the one that happens to the tool itself.
How much it costs in Lemuria. The liquidity indicator is built only if the entity reports short-term obligations. If it does not, the indicator does not exist: it does not appear as not computable, it does not enter the incomplete-assessment flag, and it is not deducted from the published coverage. Measured on an entity built for the case:
| Version | Indicators | Flags | Incomplete-assessment flag | Overall rating |
|---|---|---|---|---|
| With the liquidity datum (0.60) | 6 | 2 | no | Medium |
| Without short-term obligations | 5 | 1 | no | Low |
Supplying the datum worsened the profile, and the version with less information carried no sign of incompleteness. It is exactly the inverted incentive: the entity that reports its cash and its accounts payable comes out Medium; the one that reports neither comes out Low, and the reader of the report has no way of knowing.
The complete case is in §4.7 and it is the one to take to a meeting. An entity with 150 million of accrued and unpaid expenditure — 4.55 months of operations — that balances its current account and does not report its short-term obligations comes out of the screen at Low, with five indicators, one flag and no mark of reduced coverage. The same entity, reporting the datum, comes out Medium. There was no calculation error and no loading error: the indicator that saw the problem ceased to exist, silently.
What the tool does. On five of its six indicators, exactly what the method asks for: denominator missing or zero → not computable, exclusion from the average, and an incomplete-assessment flag with the list of affected keys. Its own documentation declares that discipline as a general rule. The sixth indicator — liquidity — skips it, and it is the only one. The manual cannot teach a rule its own tool breaks in one case out of six, so it teaches it and declares the breach: the fix is a one-liner and it has been requested.
And the publication rule that depends on no fix: the rating is published with its coverage, always. An entity with 3 of 6 indicators and band Medium is not comparable with an entity with 6 of 6 and band Medium, however much the column says the same thing. In Lemuria's portfolio all three have 6 of 6, and that datum is part of the result and not a footnote.
Where it occurs. Step 4.
What fails in the spreadsheet. The spreadsheet averages. It is what a spreadsheet does best and it is what must not be done here: six ratios, six bands, one mean. The problem is not arithmetical but conceptual — the six ratios are not interchangeable. An entity that cannot service its debt is a high risk however clean the other five are, because the other five are not going to pay its coupon. An average treats the insolvency as one datum among others and returns "moderate".
How much it costs in Lemuria, and here something has to be said against the method's own interest. On this portfolio, the simple average and the method's rule almost coincide:
| Entity | Simple average | Weighted average | Published |
|---|---|---|---|
| San Miguel | 3.000 | 3.000 | High |
| Puerto Verde | 2.000 | 2.000 | Medium |
| Aurora | 1.000 | 1.000 | Low |
The reason is that Lemuria's three entities have all six ratios in the same band, and when every ratio agrees any set of weights and any roll-up rule give the same result. A manual wanting to sell the knockout with this portfolio would be overstating, and it is as well to acknowledge it before going on: across twenty-one entity-threshold-set combinations, the knockout rule changes the result exactly once.
That once is the one that matters. Under the regime of the gate of interest over ahorro operacional, Puerto Verde has a weighted average of 2.000 — band Medium — and a legal gate at 141.7 %, well above the prohibition threshold. The method's rule publishes it at High; the average would have published it at Medium. That is: the only case in the portfolio where the average and the method disagree is the case where a legal test says the entity may not borrow. An average that dilutes that into five intermediate ratios does not produce a conservative number: it produces a number that authorises an operation.
And the opposite defect, which the method acknowledges in its own rule. A badly graded knockout produces the symmetrical error, and §4.5 measures it:
| Case | Operating balance | Weighted average | Overall rating |
|---|---|---|---|
| Current budget exactly in balance | 0.0000 | 1.480 (Low) | High |
| Current surplus of one ten-thousandth | +0.0001 | 1.240 (Low) | Low |
| No debt, no debt service and no contingent liabilities, with a current deficit of 0.5 % | −0.0050 | 1.480 (Low) | High |
A two-band jump for one ten-thousandth, and an entity with no debt rated a high credit risk for half a point of current deficit. The second is the one a small municipality with no access to credit is going to receive most often, and it has no defence: the operating balance knockout is a statement about the capacity to service debt, and an entity with no debt has no debt to service.
What the tool does. It runs the right rule — knockout first, severity-weighted average afterwards, not-computables excluded and counted — and it publishes the weights and the knockout marks in a browsable library, which is what makes this whole discussion auditable and is a merit of the product. What it lacks is the grading: firing by magnitude instead of at exactly zero, or letting the knockout set a floor in the intermediate band, and conditioning the operating balance one on non-trivial leverage. Until then, the method's publication rule is that a high rating produced only by the operating balance knockout be published with its weighted average alongside: it is the only way for the reader to tell an insolvency from an accounting zero.
Where it occurs. Step 3, and any comparison between years.
What fails in the spreadsheet. The cut-offs live in the formula. Somebody wrote >0.8 inside a nested IF four years ago, copying it from a document that is no longer linked, probably from another country and almost certainly from another version of that country's law. The spreadsheet has no place that says where that 0.8 came from, nor with what degree of confidence, nor which indicators it applies to. And when somebody changes it, no record is left that it used to be something else.
How much it costs in Lemuria. The same entity is Low, Medium or High depending on which of the seven published sets is applied:
| Threshold set | Aurora | Puerto Verde | San Miguel |
|---|---|---|---|
| Default indicative bands | Low | Medium | High |
| Gate of interest over ahorro operacional | Low | High | High |
| Interest-over-current-revenue anchor | Low | Medium | High |
| Debt-to-revenue ceiling, municipalities | Low | Low | High |
Three bands — the full range of the scale — without changing a single input. And the result has a structure worth stating as a rule, because it is the most useful thing this example produces: at the extremes, the rating is data; in the middle, it is rule book. Aurora comes out Low under all seven sets and San Miguel High under all seven, because they are far enough from any plausible cut-off. Puerto Verde runs the scale. For a register of 42 entities, the operational consequence is direct: the entities in the middle are the ones to be argued about with the threshold in hand, and publishing their band without publishing the set that produced it is not a result, it is an opinion without attribution.
Two points a spreadsheet register cannot make and that the example measures. The first: every statutory set is more permissive than the firm's screen, without a single exception in this portfolio. That is what one would expect — a legal ceiling marks the point at which borrowing is prohibited, not the point at which one should worry — but it means that loading a country set "because it is the official one" loosens the screen, and that whoever does so should know it. The second: a country set governs only the indicators its source regulates. The Brazilian municipal ceiling rewrites two cut-offs out of six and takes Puerto Verde from Medium down to Low, because those two are precisely the ones the entity does best on; the other four go on being rated against indicative bands that are not Brazilian — and the result is published with the foreign law's label on top.
What the tool does. It publishes the seven sets in a cited library, each with its source in text, its country, its issuing body and a confidence mark — direct, adapted or unverified — and it also publishes the default set with direction, cut-offs, weight and knockout mark, indicator by indicator. That is exactly what a spreadsheet cannot have and it is what makes the discussion in this section possible.
Two things are missing, and they are declared. No surface says which indicators the chosen set governs and which stay on the default bands, which is what turns an honest design limitation into a misleading statement on screen. And a set that does not exist is accepted silently: asking for the calculation with an invented key returns a threshold set identical to the default one, field by field, and the report prints "threshold set:
Where it occurs. Step 2. It is the failure with a legal consequence and the only one of the nine that can end in disciplinary proceedings.
What fails in the spreadsheet. The spreadsheet computes the law's ratio on whatever denominator was to hand. The law says interest over ahorro operacional; the spreadsheet has a debt service column and a total revenue column, so it computes service over total revenue, calls it "the law's indicator" and compares it with the law's threshold. And then it calls "alert" what the law calls prohibition.
The two errors are different and they compound. The first is one of legal arithmetic: the numerator includes amortisation, which in most of these regimes is a capital item that is not part of the test, and the denominator is a revenue aggregate instead of a surplus. The second is one of vocabulary: a gate produces a legal situation — may borrow, may borrow with authorisation, may not borrow — and an indicator produces a reading. Turning the first into the second transforms a question of law into an analyst's opinion, and on the day the comptroller asks why an operation was authorised, the opinion is of no use.
How much it costs in Lemuria. The same entity, the same day, the same accounts:
| Reading of Puerto Verde | Figure | What it says |
|---|---|---|
| Legal gate: interest / ahorro operacional | 141.7 % | Prohibition. It may not contract new public credit operations |
| Diagnostic indicator: debt service / total revenue, under the same set | 0.0838 | Band Low (that set's cut-off is at 0.10) |
A 141.7 % that prohibits and an 8.38 % that reassures, on the same entity. There is no error in either figure: they measure different things. The gate measures 85 of interest against 60 of current surplus; the indicator measures 155 of service against 1,850 of total revenue. A spreadsheet using the second number as a "conservative" substitute for the first is computing an 8 % where the law computes 142, and it is going to authorise the operation.
And there is a second figure in the same case, the one no spreadsheet ever produces: San Miguel has ahorro operacional of −50, so the gate cannot be computed. Under the logic of the law that creates it — whose definition of capacity to pay is the minimum flow of ahorro operacional that allows the debt to be serviced every year while leaving a remainder for investment — an entity with no ahorro operacional is the worst possible result of the test, not the case without information. The entity in the worst shape of the three is the only one the legal test says nothing about.
What the tool does. It computes the gate on its legal denominator: interest over ahorro operacional where the regime is that of the Colombian law, interest over current revenue where it is the Indian anchor, with the correct numerator — interest alone, without amortisation — in both cases. It is not an implementation detail: it is the correction of a defect this very tool had, and which produced exactly the failure of this subsection. And it publishes the gate's band as an indicator of its own, separate from the diagnostic, with its note explaining the legal consequence in words.
One thing is missing and it is the one in the previous paragraph: a non-positive denominator with a positive numerator should be the high band with a note, not not computable. And what is missing on the surface is saying in legal vocabulary what the band means — "prohibition" and not "high risk". Until it does, the method asks that the report translate: table 4.6 in §4 has a legal situation column for this reason, and today that column is written by the analyst.
A warning that closes the subsection and that holds for all seven sets: none of these calculations, in a spreadsheet or in the tool, is the statutory computation. The Brazilian ceiling is evaluated here as gross debt over total revenue when the law says net debt over receita corrente líquida; the Peruvian one, over one year when the law says a four-year average. It is a screening approximation, and before any compliance use the calculation is redone with the legal definitions on audited figures. That sentence is not a liability disclaimer: it is part of the method.
Where it occurs. Step 8, and the whole of Step 9.
What fails in the spreadsheet. The deliverable of a spreadsheet is the spreadsheet, or a screenshot of one of its sheets pasted into a document. It has no generation date, because the file's date is that of the last time somebody opened it. It does not have the inputs that produced the figure, because they are on another sheet that was not printed. It does not have the threshold set that was applied, because it is inside the formulas. And it has no scope warning, because the warning lived in the email the file was sent with two years ago.
How much it costs in Lemuria. The cost is not measured in a badly computed figure but in a question that cannot be answered. A municipal council receives a risk scorecard saying "San Miguel: overall risk High" with six ratios and six flags. The questions that council is going to ask, and that the document cannot answer: which financial year are these accounts from? Which total revenue was used — 620, which is the central administration's figure, or the consolidated one with the transferred services, which are outside the perimeter? Does the 0.1290 of debt service include amortisation? Is the 0.10 cut-off this country's law or an international body's indicative band? Does High mean the municipality may not borrow, or that somebody thinks it is in bad shape?
None of those five questions is about the calculation. All of them are about provenance, and all of them have an answer in §4 of this manual and none in the document the council has in its hands.
What the tool does. Less than it should, and it has to be said without decoration because it is the subsection where the product is weakest. The workbook and the PDF print title, entity, overall rating, the indicator table with its value, its band and the two cut-offs applied — which is already more than a spreadsheet delivers, because the cut-off is written next to the value — and the flags. And they stop there: there is no generation date, there is no inputs block, there is no direction column — so that the reader does not know whether a value above the cut-off is good or bad without the manual alongside — and there is no scope warning, even though the module declares itself a screen in three different places in its interface and in neither of its two deliverables. There is besides an encoding defect that removes the minus sign from the labels in the PDF, so that "operating balance (current revenue − current expenditure)" is printed without the operation.
All four are requested and they are matters of presentation, not of engine. What the method requires until they exist, and which is a reviewer's checklist: every published figure carries the date of the accounts, the threshold set with its source, the perimeter with its exclusions, the coverage of the diagnostic, and the warning that it is a screen and not a credit rating. Today those five lines are written by the analyst around the report; tomorrow the report should write them.
Where it occurs. Step 9. It is the failure that only appears in the second year, and that is why it is the one nobody anticipates.
What fails in the spreadsheet. Last year's register is a file with a name ending in _v3_final_REV. This year's was made by copying it and overwriting the figures. The difference between the two exists — there are entities that changed band — and it cannot be explained by cause, because in the copy four things moved at once: new entities came in, the accounts were updated, somebody adjusted a cut-off, and in the middle of it a statutory ceiling changed.
How much it costs in Lemuria. This is the subsection where the example cannot give the figure, and the reason is the same limitation §4 declares from its first page: the portfolio is of a single period. There is no previous year's register to compare, so what follows is the arithmetic of the comparison that would have to be possible, with this portfolio's magnitudes.
Suppose that between two financial years two ordinary things happen: the statutory debt-to-revenue ceiling rises from 0.80 to 1.00 — which is what actually happened in one of the regimes this manual cites — and Puerto Verde's accounts do not change. Its debt burden, 0.7027, goes from band Medium to band Low without the entity having amortised a single unit. A register publishing "Puerto Verde improved" is lying with correct figures: the entity did not move, the rule moved. The only honest reading requires recomputing both years on the same basis, and for that the register has to know, for each figure, which threshold set it was produced with.
And the symmetrical case, which is the one that makes the series useless: if in the second year Puerto Verde supplied its current-account split and in the first it did not, its operating balance would go from +0.0811 — gross operating margin — to +0.0349 — current balance — from band Low to band Medium, without the entity having spent a unit more. Four and a half points of apparent deterioration produced by an improvement in data quality.
What the tool does. Each calculation comes out with its threshold set identified and with the cut-offs applied printed next to the value, so that two results produced with different rules are not confused by accident. That is half of what is needed.
The other half does not exist yet, in the tool or in any spreadsheet: the versioned register. What the method asks for in Step 9 is that the difference between two years be published decomposed by cause — entities entering or leaving the perimeter, changes in the figures, changes of thresholds, changes of legal regime, events — and that a change of legal regime explicitly invalidate the year-on-year comparison unless both years are recomputed on the same basis. And that an upward change of band open a case outside the calendar, instead of waiting for the following year's update.
The spreadsheet wins on three things and they have to be conceded, because an argument that does not concede them convinces nobody who uses one. It wins on local transparency: the arithmetic is on show and the reader can follow it cell by cell, while an engine has to be believed or its code read. It wins on improvisation: the column that is needed is added in thirty seconds, and no tool of this kind allows that. And it wins for understanding one entity, which is exactly what most territorial finance analysts use it for and what they will go on using it for.
The register wins on the five things this section has walked through, and all of them are properties of the register and not of the calculation:
| What a register needs | Why a spreadsheet does not give it |
|---|---|
| Invariants | A broken identity is a number, not an error (§6.3) |
| Explicit coverage | A missing datum is an empty cell, and an empty cell improves the average (§6.4) |
| Provenance of the threshold | The cut-off lives in the formula, with no source and no version (§6.6) |
| Separation of the legal gate | The law is computed with whatever denominator was to hand (§6.7) |
| Versions | Two different files are not two versions of the same thing (§6.9) |
And there is a sixth argument, which is not technical and is the one that decides: the register has to hold up its number in front of a third party. A comptroller asking why a credit operation was authorised, a council arguing about a band, an international body assessing the country's public financial management and asking for coverage, publication lag and a consolidated report. None of the three accepts "we computed it in a spreadsheet". All three accept "we computed it with this method, against these cut-offs from this source, on these accounts of this date, with this coverage, and here is last year on the same basis".
The final honesty, which is the discipline of the series: of the nine failures in this section, the tool corrects six, half-corrects two and does not correct one. It corrects the separation of transfers, the not-computable discipline on five of six indicators, the roll-up rule with its knockout, the cited threshold library, the computation of the legal gate on its denominator, and the identification of the set applied in each result. It half-corrects the report — it has the cut-offs, it lacks the date, the inputs, the direction and the scope — and the versioned register, which identifies the rule and does not decompose the difference. And it does not correct the budget identities, which is the whole of Step 1 and where a spreadsheet and this tool are today equally defenceless.
That list does not weaken the argument: it makes it usable. A reader who knows which six things the tool solves for them and which three they have to keep doing themselves can decide; a reader who is promised nine is not going to believe the tenth.
All references were consulted on 25 September 2026. Unless stated otherwise, each document was read in its official version — a PDF or text downloaded from the site of the publisher or of the issuing body.
✔ = verified by direct reading for this manual · ✔s = verified through another reference in this list, which describes or reproduces it, and not in its original source; which one is stated · PV = to be verified (existence confirmed; the datum indicated is checked against the document before being quoted in the body) · BL = blocked from the working environment: the publisher returned a 403, a certificate error or a timeout, and no route around the block was sought.
Rule of this edition. No statement in §2 rests on an entry marked PV or BL. What could be opened is cited with its article, its paragraph or its page; what could not is either absent from the body, or in the body declared unverified and attributed to the secondary source that describes it. The working index proposed a stricter rule — that the published §7 contain no entry marked [to be verified]; this edition modulates it, because a list that deletes what could not be opened hides from the reader the real state of the evidence. The PV and BL entries are published with their mark, and the list of what is missing is at the end.
A note on the legal citations in this English edition. Each national instrument keeps its official name in its own language, with an English rendering of the title in parentheses. Where the Spanish edition cited a Spanish rendering of an instrument whose official text is in another language — the three Brazilian entries — this edition cites the official Portuguese name; no official English edition of any of the three was located, and none was sought around a block, so the English edition of those texts is [to be verified]. Law numbers and official gazette numbers keep the typography of their own jurisdiction.
Saxena, S. (2022). How to Manage Fiscal Risks from Subnational Governments. IMF How To Note 22/03, Fiscal Affairs Department, International Monetary Fund, Washington, D.C. ISBN 9798400218378 (web PDF). Sections and pages cited in §2.1: p. 1 (the four ways subnational risk reaches the central budget; the thirteen episodes of macro-critical materialisation with an average cost of 3.7 % of GDP and a maximum of 12 %, taken from reference 5); box 1, p. 2 (the episodes in Brazil, Argentina, Mexico, India, Hungary, France, Austria and the United States); figure 1, p. 2 (of 33 countries with a fiscal transparency evaluation 2013-21, close to half with no direct control of subnational borrowing and with no information or limited information; the 6 / 10 / 12 / 5 breakdown); figure 5, p. 6 (national and subnational public financial management scores in nine countries); III.A, pp. 6-7 (the five analytical dimensions: fiscal capacity and flexibility, operating performance, liquidity management, debt capacity and asset management); box 2, p. 8 (Mexico's early warning system, its three indicators, its three zones and its threshold table, citing Government of Mexico 2017); box 3, p. 9 and footnote 9, p. 8 (the financial sustainability rating framework of the New South Wales treasury corporation, 2013, with its ten indicators, its four categories and its weights; and the seven weighted factors with which a rating agency builds the credit profile of a subnational government outside the United States); p. 9 (the composite index of Turley, Robbins and McNena for the 34 Irish local governments); pp. 9-10, "Quantifying Risk" (recording the maximum exposure is enough; the two components that have to be measured; that in accounting terms they are explicit or implicit contingent liabilities of the central government; and the split between short and long term); box 4, p. 10 (reporting practices in Finland, Peru, the Philippines and Russia); table 1, p. 12 (subnational borrowing regulation thresholds in ten countries); table 2, p. 14 (the four approaches to controlling subnational borrowing and their preconditions, adapted from IMF 2009); box 5, p. 15 (the Colombian regime, including the elimination of the amber zone by the 2003 fiscal responsibility law, citing Liu and Webb 2011); box 6, p. 16 (New Zealand's subnational architecture); III.C, p. 17 (the rule against identifying entities or publishing probabilities, on moral hazard grounds, and the exception for rescues already approved); III.D, pp. 17-18 (the four contents of disclosure); box 7, p. 18 (the three levels of the fiscal transparency code: basic, good and advanced); V, pp. 19-20 (the four conclusions); annex 1, p. 21 (the table of suggested ratios, including debt over free own revenue and the rule of keeping the number of indicators manageable); annex 2, p. 22 (the elements of a sound subnational public financial management system). https://www.imf.org/-/media/Files/Publications/HowToNotes/2022/English/HTNEA2022003.ashx. ✔ (official publisher's PDF, read in full). It is the source that fixes the chain diagnostic → supervision → central-level exposure, and the only one in the literature that runs that whole chain for the subnational object. In the working index this reference appeared as blocked — the publisher's electronic library returned a 403 to the article's XML and PDF; the publisher's own How To Notes collection PDF did open, and §2.1 was written on it.
de Mello, L. and Ter-Minassian, T. (2024). Managing Rising Subnational Fiscal Risks. OECD Working Papers on Fiscal Federalism, No. 46, June 2024. Paris: OECD Publishing. OECD Network on Fiscal Relations across Levels of Government; paper discussed at the Network's meeting of 25-26 April 2024 and authorised for publication by the Director of the Public Governance Directorate. JEL classification: H12; H70; H77. Paragraphs cited in §2.2: ¶1 (the definition: "events whose realisation leads to significant deviations of revenue and/or expenditure from budgeted amounts"); key messages, p. 3 (the cycle identify → analyse → mitigate → transfer where appropriate → responsibly accommodate the residuals); §2.1 to §2.6 (the taxonomy of six sources: macroeconomic, climate and disasters, public health, contingent liabilities, weaknesses in budget institutions and processes, and digitalisation); ¶30 (the positive correlation between risk families and the obligation to incorporate it); ¶31-33 (the elements of the framework and the governance arrangements); ¶34-36 (identification; dispersion of information; the focal point in the finance department); ¶37-38 (analysis and quantification; recourse to qualitative high/medium/low judgement where capacity falls short); ¶43-45 and box 2 (inventory of guarantees at face value; the two steps of the analysis; the three methods of estimating probability and the preference for the credit rating one, citing World Bank Treasury 2019); ¶47 (the Colombian methodology for valuing litigation); ¶52-53 (the fiscal risk annex in the annual budget, and the limit: avoid publishing quantitative estimates of the probability and cost of individual risks — expressly, the realisation of implicit guarantees — where they would create moral hazard); ¶70-72 (why the national level cannot stand aside, and the two guiding principles of its intervention); ¶85-88 (conclusions, and the finding that no national or comparative databases exist on the incidence and management of subnational fiscal risks). DOI 10.1787/58437ac8-en. https://www.oecd.org/content/dam/oecd/en/publications/reports/2024/06/managing-rising-subnational-fiscal-risks_80fa76f4/58437ac8-en.pdf. ✔ (official PDF, read in full).
International Monetary Fund (2014). Fiscal Transparency Code. Washington, D.C. The indicator on fiscal coordination with subnational governments and its three levels of practice — basic, good and advanced — which §2.6 uses as a reading scale for the frequency column. ✔s the content of the indicator, read in reference 1, box 7 · PV the text of the code. It is also the yardstick to which M9 delivers its result.
International Monetary Fund (2016). Analyzing and Managing Fiscal Risks — Best Practices. IMF Policy Paper, Washington, D.C. The four-step fiscal risk management framework that reference 1 cites as its skeleton and that reference 2 cites among the sources of good governance practice. ✔M2/M7 (verified in those manuals of the series) · PV the chapter applicable to the subnational level.
Bova, E., Ruiz-Arranz, M., Toscani, F. and Ture, H. E. (2016). The Fiscal Costs of Contingent Liabilities: A New Dataset. IMF Working Paper 16/14, Washington, D.C. The source of the thirteen episodes of macro-critical materialisation of subnational contingent liabilities between 1990 and 2014 in eighty countries, with their average and maximum cost. ✔s the record, scope and the three magnitudes, read in reference 1, p. 1 · ✔M6 authorship and number · PV direct reading. §2.1 cites the magnitudes through reference 1, which is how it credits them.
World Bank Treasury (2019). Methodologies for estimating the probability that guarantees are called — credit rating, statistical models, financial models — and the associated cost. ✔s content, read in reference 2, box 2 and footnote 9 · PV direct reading. Boundary with M7: there the guarantee is valued; here it is only inventoried.
Blöchliger, H. and Kim, J. (eds.) (2016). Fiscal Federalism 2016: Making Decentralisation Work, ch. 5, "Monitoring Sub-Central Government Debt: Trends, Challenges and Practices". Paris: OECD. Diversity and weaknesses of subnational fiscal reporting practice across OECD countries — timeliness, frequency, reliability and comparability — and subnational insolvency practices. ✔s use and conclusions, read in reference 1, pp. 10 and 18 · PV direct reading.
World Bank — City Creditworthiness Initiative and its City Creditworthiness Self-Assessment & Planning Toolkit; and the same initiative's local government borrowing database. Initiative created in 2014, co-funded by the Bank's public-private infrastructure advisory facility, the Korean green growth partnership and a private foundation; it operates through creditworthiness academies, technical assistance and knowledge products. The tool is a self-assessment questionnaire on service mandates, financial management, financial performance, planning process and enabling environment, from which a list of creditworthiness challenges with an intensity from 0 to 100 % and an action plan are derived; it does not compute financial ratios. Its scope of "local authority" expressly includes municipalities, states, regions, utility companies, municipal banks and subnational public-private partnerships. ✔ nature, scope, co-funding and output of the tool (verified in the source pass of 25‑09‑2026) · ✔ closed 27‑09‑2026 the content of the questionnaire — the four areas (Mandates, Financial Performance, Financial Management, Planning & Enabling Environment) and the 0–100% intensity algorithm — by direct reading of the City Creditworthiness Self‑Assessment & Planning Toolkit — User Guide (26 pp., 2022), downloaded by hand by David (pp. 3, 5 and 8–9). PV the exact coverage (countries, entities) of the local-government borrowing database: the questionnaire's user guide does not describe it, and no other primary source was downloaded for it. It is decision D2 of the index: this initiative is not the methodological basis of the engine and §2.5 explains why; with its content now verified, it remains a product roadmap item for the missing qualitative layer.
PEFA — the public financial management assessment framework, in its dimension on monitoring subnational governments (coverage, publication lag and consolidated report), which Step 8 of §3 names as one of the four destinations of the result. ✔s the comparative use across levels of government, read in reference 1, figure 5 and p. 6 · PV the text of the framework and the exact wording of the dimension. Without that reading, §3 names it and does not cite its indicator by number.
New South Wales Treasury Corporation (2013). Financial sustainability study of 152 local governments of the state of New South Wales (Australia): ten indicators in four categories — financial flexibility, liquidity, debt service, and asset renewal and capital works — with a benchmark and a weight per indicator, and seven result bands, from "very strong" to "in distress", plus a positive, neutral or negative three-year outlook. ✔s structure, indicators, benchmarks and weights, read in reference 1, box 3 and table 3.1, p. 9 · PV direct reading. It is the closest published antecedent to the method of §3 that exists, and that is why it is cited: a composite score with a declared weighting, not a simple average.
Turley, G., Robbins, G. and McNena, S. (2015). Financial performance index for the 34 Irish local governments: seven ratios, scored from −2 to +2 by quintile, aggregated into a composite score from −14 to +14. ✔s method and range, read in reference 1, p. 8 · PV direct reading.
Liu, L. and Webb, S. B. (2011), on the Colombian framework for regulating subnational borrowing; and Liu, L. and Waibel, M. (2008; 2009), on market discipline and comparative subnational insolvency. ✔s use and conclusions, read in reference 1, box 5 and section IV · PV direct reading.
The regional fiscal sustainability tool of the region's development bank, which the module's on-screen manual declares among its references and which this manual names as the sovereign counterpart the subnational diagnostic complements. PV in its entirety. It is not cited in the body of §2; it is collected here because §5.8 has to resolve the divergence between what the offering, the product and this manual declare (D2, H20), and that divergence includes this reference.
Colombia — Ley 358 de 1997, "por la cual se reglamenta el artículo 364 de la Constitución y se dictan otras disposiciones en materia de endeudamiento" (regulating that constitutional article and laying down other provisions on borrowing). Diario Oficial No. 42.973 of 4 February 1997. Art. 1 (the borrowing of territorial entities may not exceed their capacity to pay, defined as "the minimum flow of ahorro operacional that allows debt service to be met in full in every year, leaving a remainder to finance investment"); art. 2 (presumption of capacity to pay where interest does not exceed 40 % of ahorro operacional, and exemption from additional authorisations; parágrafo: statutory definition of ahorro operacional = current revenue − operating expenditure − transfers paid, with the enumeration of what current revenue is and the rule that salaries, fees, benefits and contributions count as operating expenditure even if budgeted as investment; and the restriction of the operations to investment only); arts. 4 and 5, the intermediate band and the authorisations for capital municipalities, repealed by art. 114 of Ley 795 de 2003; art. 6, in the text given to it by art. 30 of Ley 2155 de 2021: "Save as provided in this article, no territorial entity may contract new public credit operations where its interest / ahorro operacional ratio exceeds 60 % or its debt outstanding / current revenue ratio exceeds 100 %", with its parágrafos 1 and 2 (risk rating and ministerial authorisation conditions, differentiated by the entity's category) and its parágrafo transitorio (financial years 2021-2023); the earlier text of art. 6, the one in force until 2021, which set the debt-to-current-revenue ceiling at 80 % with the ministry's authorisation; art. 7 (calculation base: the budget outturn of the immediately preceding year, adjusted for the inflation target); art. 9 (performance plans; quarterly submission to the ministry; in force until the interest / ahorro operacional ratio falls to 40 %); art. 10 (breach of the plan suspends all new borrowing); art. 11 (pledging of earmarked revenue); art. 12 (registration system for territorial entities' credit and for the guarantees they grant); art. 13 (public entities requesting information on territorial borrowing must conform to this law's methodology); art. 14 (disciplinary offence); art. 15 (two-year transitional regime, which mentions the same 60 % and 80 %). https://www.funcionpublica.gov.co/eva/gestornormativo/norma.php?i=3423. ✔ (the full articles with their earlier text and their notes on validity, read in the regulatory database of the Departamento Administrativo de la Función Pública). The two portals the working index flagged as failing on certificate grounds are still not used; this route did open and it is official. PV: the text of Ley 2155 de 2021 as published in the Diario Oficial, and Ley 617 de 2000, which §2.6 names through reference 1 and does not cite by article.
Brazil — Resolução do Senado Federal n.º 40, de 20 de dezembro de 2001 (Federal Senate Resolution on the global ceilings for the consolidated public debt and the public securities debt of the States, the Federal District and the Municipalities, pursuant to art. 52, VI and IX, of the Federal Constitution), in its text as updated by Resolução n.º 5 de 2002. Art. 1, § 1, items I to V (which entities it covers, what a dependent state enterprise is, what consolidated public debt is, what public securities debt is and, in item V, that net consolidated debt = consolidated public debt less cash holdings, financial investments and other financial assets); art. 1, § 2 (exclusion of obligations between the direct administrations and their own funds, autarchies, foundations and dependent enterprises); art. 2 (definition of receita corrente líquida, with its deductions, and its computation over the reference month plus the eleven preceding ones); art. 3, items I and II (2.0 times RCL for States and the Federal District; 1.2 times for Municipalities, by the end of the fifteenth financial year counted from the close of the year of publication), and its parágrafo único (if the deadline is missed, art. 31 of Lei Complementar n.º 101 de 2000 applies); art. 4 (minimum reduction of one fifteenth of the excess per financial year; measurement every four months recorded in the fiscal management report of art. 54 of the same complementary law; submission of data to the ministry within 30 days); art. 5 (bar on contracting credit operations for as long as the irregularity lasts). https://www2.camara.leg.br/legin/fed/ressen/2001/resolucao-40-20-dezembro-2001-429320-normaatualizada-pl.html. ✔ (consolidated text published by the Chamber of Deputies' documentation and information centre, read) · PV an official English edition, which was not located.
Brazil — Resolução do Senado Federal n.º 43, de 21 de dezembro de 2001 (Federal Senate Resolution on domestic and external credit operations of the States, the Federal District and the Municipalities, including the granting of guarantees), their limits and conditions of authorisation, in its updated text. Art. 1 (scope); art. 4 (receita corrente líquida for these purposes); art. 7, items I, II and III (16 % of RCL for the total amount of a financial year's operations; 11.5 % of RCL for the annual commitment to amortisation, interest and other charges of the consolidated debt, including amounts to be disbursed on operations already contracted and to be contracted; and the cross-reference to the debt ceiling of the previous resolution); art. 9 (total outstanding stock of guarantees granted ≤ 22 % of RCL, liftable to 32 % where the conditions of its parágrafo único apply cumulatively, among them not having been called on guarantees in the previous 24 months and being in compliance with the net consolidated debt limit). https://www2.camara.leg.br/legin/fed/ressen/2001/resolucao-43-21-dezembro-2001-429342-normaatualizada-pl.html. ✔ (consolidated text, read) · PV an official English edition, which was not located. It is the source of the pair of debt service cut-offs the module's Brazilian municipal set used with no verified source: the 11.5 % is item II of this article 7, and it can now be cited. The 9 % that accompanies it as an early warning cut-off is not in the instrument: it is an Austral calibration and should be labelled as such.
Brazil — Lei Complementar n.º 101, de 4 de maio de 2000 (Complementary Law on fiscal responsibility). Its arts. 31 (consequences of exceeding the debt limit), 54 and 55 (fiscal management report) are the ones the two previous resolutions invoke. ✔s the content of the three articles in what the resolutions reproduce and cross-refer to · BL the consolidated text of the law: the Presidency's official site returned a reset connection and it was not worked around · PV an official English edition, which was not located.
Peru — Decreto Legislativo n.º 1275 (Legislative Decree approving the framework for fiscal responsibility and transparency of Regional Governments and Local Governments). Published in El Peruano, normas legales, 23 December 2016; in force from 1 January 2017. Art. 1 (purpose); art. 3 (definitions: total debt outstanding; total current revenue; total non-financial current expenditure with its three components; ahorro en cuenta corriente = total current revenue − total non-financial current expenditure; and the statistical coverage, which includes the decentralised bodies, entities and dependencies of the entity whose central purpose is not to produce goods and services for the market); art. 5 (subjection of the budget, borrowing and financial equilibrium laws and of budget execution to the fiscal rules); art. 6 (the two rules: (a) total debt outstanding over the average of total current revenue of the last four years — or over the limit of the Second Supplementary and Final Provision of Ley 29230, whichever is lower — not exceeding 100 %; (b) the ahorro en cuenta corriente must not be negative); art. 7 (circumstances triggering corrective measures, including breach of subparagraphs (a) and (b) of art. 6; list approved by ministerial resolution in the first fifteen days of June); art. 8 (types of corrective measure: preventive monitoring; bar on arranging new short-term borrowing operations; and bar on obtaining the ministry's favourable opinion for a new public-private partnership contract or works-for-taxes agreement involving additional borrowing or greater commitments over future resources; and communication of the list to the banking supervisor, to Congress and to the Comptroller General); art. 9 (technical support); art. 10 (quarterly monitoring report within 45 days of the quarter's close, and an annual compliance evaluation report submitted to Congress); art. 11 (Multi-Year Fiscal Management Analysis Record). https://cdn.www.gob.pe/uploads/document/file/251489/226855_file20181218-16260-69udvb.pdf, via the instrument's record on the Ministry of Economy and Finance portal (https://www.gob.pe/institucion/mef/normas-legales/226855-1275). ✔ (text of the official publication, read). PV: the consolidated text in force. The copy read is the original 2016 publication; there exists at least one amendment by a later law (on art. 24) and an amending legislative decree of 2018, besides the implementing regulation approved by supreme decree in 2017. The articles this manual cites do not appear amended in the sources consulted, but that was not verified against an official consolidated text. This regime is the only one of the five that turns the current balance into a legal rule, which §2.4 uses to ground the method's operating balance knockout.
India — Fourteenth Finance Commission, paragraph 14.64 of its report (volume I), read through its official application: a state's fiscal deficit is anchored to an annual limit of 3 % of gross state domestic product; the state is eligible for an additional 0.25 % if its debt-to-state-product ratio was ≤ 25 % in the previous year; and for another 0.25 % if its interest payments were ≤ 10 % of revenue receipts of the previous year; the flexibility under either option, or under both, is available only if there was no revenue deficit in the year the limit is set or in the immediately preceding one; and the ratios are taken from the state's finance accounts of two years earlier. Official Government of India sources: Press Information Bureau release, Ministry of Finance, on the simplification of the approval process for the additional fiscal deficit limit (https://www.pib.gov.in/Pressreleaseshare.aspx?PRID=1536470), and Cabinet release on the approval of the recommendations of paragraphs 14.64 to 14.67 of the report (https://www.pmindia.gov.in/en/news_updates/cabinet-approves-recommendations-of-14th-finance-commission-on-fiscal-deficit-targets-and-additional-fiscal-deficit-to-states-during-2015-20/). ✔ (the two official releases, read) · PV the Commission's report in its own text: the Finance Commission's site returned a 404 on the report's download paths. Validity warning, and it is the one that matters: the period of these recommendations is 2015-2020. The regime applicable to the current period is that of the following Commission, and it was not verified. The manual cites the interest anchor with its period, and the module's threshold set that invokes it should do the same.
Chile — Ley N.º 18.695, Orgánica Constitucional de Municipalidades (Organic Constitutional Law on Municipalities), consolidated, coordinated and systematised text established by Decreto con Fuerza de Ley N.º 1 de 2006 of the Ministry of the Interior (Diario Oficial of 26 July 2006). Art. 13 (exhaustive list of municipal assets, letters (a) to (h): corporeal and incorporeal property; the regional government's contribution; the share in the Fondo Común Municipal; fees for services, permits and concessions; income from its activities and establishments; taxes of clear local identification — property tax, vehicle circulation permit, business licences; fines and interest accruing to the municipality; and such other income as the laws in force assign to them. With no paragraph on borrowings, debt or credit operations); art. 14 (autonomy in the administration of its finances; the Fondo Común Municipal as a solidarity redistribution mechanism, with its composition); art. 27, letters (c) to (f) (quarterly report to the council on the monthly detail of accumulated liabilities, broken down into the accounts payable of the municipality and of the municipal corporations, which must report their financial position to that unit; public monthly register of the breakdown of expenditure; submission to the Subsecretaría de Desarrollo Regional y Administrativo, which reports at least half-yearly to the Comptroller General; and publication of the quarterly report and the monthly register on the municipality's website or, failing that, on the undersecretariat's portal); art. 29, letter (d) (quarterly report from the control unit on the progress of the budgetary programme year and on compliance with social security payments, including those of the services incorporated into municipal management and those administered by municipal corporations); art. 140 ("No municipal corporation, foundation or association, created or to be created under this or other laws, may contract borrowings."). It was further verified that the word "credit" does not appear once in the full text. https://www.subdere.gov.cl/transparencia/ley20285/pdf/DFL-1-18695.pdf. ✔ (consolidated text generated by the Library of the National Congress and published by the undersecretariat, read in full) · PV the text in force as at 2026: the copy available corresponds to the last version with effect from 29 October 2014 and ending 31 July 2016, and the later reforms were not read. Numbering warning, which must be known before citing: the article numbers of the consolidated text do not coincide with those of the original law, and part of the literature cites the original numbering. This manual cites the consolidated text, which is the operative one, and the check that those same articles keep their number in the version in force as at 2026 is outstanding (see "What remains to be verified").
Chile — Ley N.º 19.175, Orgánica Constitucional sobre Gobierno y Administración Regional (Organic Constitutional Law on Regional Government and Administration), consolidated, coordinated, systematised and updated text established by Decreto con Fuerza de Ley N.º 1-19.175 de 2005 of the Ministry of the Interior (Diario Oficial of 8 November 2005). Art. 69 (assets of the regional government, letters (a) to (i): property transferred by the Treasury; property lawfully acquired and its fruits; donations, inheritances and legacies; income from services rendered and from permits and concessions; income under the final subsection of No. 20 of art. 19 of the Constitution; resources of the Fondo Nacional de Desarrollo Regional; the obligations it contracts in the course of its activities, in accordance with the law; rights and obligations arising from its participation in associations; and such other resources as the law provides. With no paragraph on borrowings); art. 70 (regime of assets); art. 75 (favourable report from the planning body and, for projects financed with external credit, compliance with the requirements of the loan agreements); art. 101 (formation of corporations and foundations by agreement of two thirds of the regional council; annual contribution limited to 5 % of the investment budget; "In no case may the contribution of the regional governments be financed by contracting borrowings"; financing of those entities' programmes and projects up to 50 % with regional resources; and "Regional governments may not secure or guarantee the financial commitments contracted by such corporations or foundations; nor shall those commitments give rise to any action for payment against them"). https://www.subdere.gov.cl/sites/default/files/documentos/ley_19175_actualizada_mayo_2017.pdf. ✔ (consolidated text generated by the Library of the National Congress, read) · PV the text in force as at 2026: the copy corresponds to the last version with effect from 15 October 2016, earlier than the 2018 regionalisation reform, whose effect on these articles was not read. It is the task the working index declared blocking for the Chilean row, and it is resolved in substance — the regional asset regime follows the same pattern as the municipal one — and open on validity.
Chile — Constitución Política de la República, art. 63, Nos. 7 and 8 (the matters reserved to statute that authorise the State, its bodies and the municipalities to contract borrowings for specific projects, and those that authorise operations committing the credit or the financial liability of the State and of the municipalities). BL. It is the piece that explains why municipal and regional assets are listed without borrowings — Chilean subnational borrowing is not ordinary: it requires a statute — and §2.6 describes it without citing it, because it could not be opened: the legislation service of the Library of the National Congress returned a 401 to every query path from this environment, and the two chambers' repositories returned 403 and 404. None was worked around. It is the first on the list of what has to be opened before publication.
United States — a rating agency's methodology and net debt medians for local governments. The module used to publish a threshold set attributed to it, marked adapted. This manual named the source and never reproduced its figures, for the licensing and trademark reason of §2.3 and because an agency median describes a universe of rated entities, not a risk threshold. The recommendation that accompanied this entry — replace the set with an Austral calibration of its own for high-income local governments, labelled as such — has been delivered, and the attributed set was withdrawn from the library. The entry is kept because the argument remains the firm's doctrine and because anyone wanting to compare against that agency must go to its published source: review its terms of use before publishing any of its figures, here or in the product. It is the same move M6 applied to a threshold its engine had attributed to the wrong source.
Mexico — Ley de Disciplina Financiera de las Entidades Federativas y los Municipios (Financial Discipline Law for the Federated Entities and the Municipalities; DOF 27‑04‑2016, last reformed DOF 10‑05‑2022; current text consulted on the Chamber of Deputies' portal, downloaded by hand by David on 26‑09‑2026), and the Secretaría de Hacienda y Crédito Público's Alert System that applies it. ✔ by direct reading: the three indicators of art. 44 (debt and financial obligations over freely disposable revenue; the service of that debt over the same base; short-term obligations and payables, net of cash and banks, over total revenue); the classification into three levels of art. 45 (sustainable, under observation, high); the Net Financing Ceiling by level of art. 46 (15% of freely disposable revenue if sustainable, 5% if under observation, zero if high); the fiscal-responsibility agreement required of an entity that lands in the high level (art. 47); and the publication frequency of art. 48 — quarterly for federated entities (within 60 calendar days of the quarter's close), semi-annual for municipalities (within 90 days) and annual for other public entities. (Corrects the manual: the Fund's note (reference 1, box 2) and the working index summarised the frequency as quarterly without distinguishing by entity type; the Law distinguishes, and the manual now follows art. 48.) PV against the Law's text: that an entity defaulting on its financial obligations is automatically classified at the most severe level, a detail verified only through reference 1, which cites Government of Mexico (2017) — art. 44 refers the "specific definition of each indicator, its application [and] measurement frequency" to administrative provisions of the secretariat that were not opened, and that rule, if it exists, would be there and not in the Law's own articles. That is why Mexico now has its own row in the table in §2.6, cited by article.
Chile — Sistema Nacional de Información Municipal (national municipal information system), of the Subsecretaría de Desarrollo Regional y Administrativo. It is where what art. 27 of reference 20 requires to be produced is consolidated and published. It offers search by indicator and by variable, a budget classifier, a dictionary of variables and a dictionary of indicators, a commune fact sheet, a download centre, and publications of municipal data, expenditure and liabilities and the Fondo Común Municipal. https://www.sinim.gov.cl/. ✔ existence, nature and structure of the offering (portal consulted) · PV, and this is a warning and not a formality: the indicator and variable menus are offered for the period 2001-2013 and the budget classifier for 2008-2013, while the system's institutional publication compiles information for 2021-2024. The effective temporal coverage and the correspondence between the published fields and the twelve inputs the method asks for must be verified field by field before building any series on this source. It is the condition of option (b) in §4.
The concept of deuda flotante in the Chilean budgetary framework: the difference, at year-end, between total expenditure accrued in the year and the total payments corresponding to that expenditure; that is, accrued expenditure left unpaid. It is neither accumulated debt nor overdue debt. ✔ definition (verified in the source pass of 25-09-2026) · PV the exact regulatory or instructional reference that establishes it. It is the obligation the Chilean municipality actually carries and that none of the engine's six indicators measures (§2.6, §4.7).
They are cited as "Austral, title". All eight are published at https://austral-intelligence.com/research/ (Spanish version at https://austral-intelligence.com/es/research/), with HTML and PDF at the same path; the eight addresses were checked one by one on 25 September 2026. The series numbers are omitted, as in M2, M6 and M7.
No work of the firm's own on subnational fiscal risk is cited, because none exists. The reason, and what that hole teaches, are written in §2.7.
[to be verified] to verified in an official government source, with a validity warning the index did not have: the period of the recommendation cited ended in 2020. The second was documented via a secondary source only and, as of 27‑09‑2026, is verified by direct reading of the Law and has its own row in §2.6.Six points, in order of importance for the body of the manual. None of them changes a rule of the method; four change a citation, which in this series is much the same thing.
(i) Article 63, Nos. 7 and 8, of the Chilean Constitution (reference 22). It is the piece that turns "municipal assets do not include borrowings" into "Chilean subnational borrowing exists but is not ordinary: it requires a statute". §2.6 today asserts the first, which is verified, and describes the second without citing it. With the article open, the argument of the Chilean box gains its central piece. The legislation service returned a 401 to every path; David needs to download the text from a browser with a session, as was done in M6 with the Fund's user guide.
(ii) The text in force as at 2026 of the two Chilean organic laws (references 20 and 21) and, with it, confirmation that articles 13, 14, 27, 29 and 140 of the first and 69 and 101 of the second keep their numbers. The copies read have declared validity up to 2016. It is the same block and the same route: a download from the legislation service.
(iii) The consolidated text in force of the Peruvian legislative decree (reference 18) and the reach of its later amendments over articles 6, 7, 8 and 10. The copy read is the original 2016 publication.
(iv) The Indian regime of the current period (reference 19). What is verified corresponds to a period that ended in 2020. Until this is closed, the manual cites the interest anchor with its period and the product should do the same in its threshold set.
(v) The text of the Mexican law (reference 24) and that of the Colombian Ley 617 de 2000 (within reference 14), both in order to cite by article what is today cited through the Fund's note. The first opens the sixth row of §2.6.
(vi) The content of the city creditworthiness initiative's questionnaire and the coverage of its database (reference 8), and the terms of use of the rating agency's methodology (reference 23). Neither of the two conditions §2 in this edition: the first because the initiative is not the declared basis, the second because the manual does not publish its figures. Both condition product decisions.
And a finding that is not a task but a result: of the ten verification points the working index left open, six are closed in this pass — the Fund's note, the Colombian articles, the two Brazilian resolutions, the Peruvian instrument and the Indian anchor — one changed in nature — the Chilean regional regime, verified in substance and open on validity — and one remains blocked by the publisher and was not worked around: the Chilean Constitution. (Updated 27‑09‑2026: the Mexican instrument and the multilateral bank's questionnaire, both listed here as blocked, are now closed by direct reading of the sources David downloaded by hand — see references 8 and 24.)