Manual M5 · Austral Manual Series
Download PDF ↓Versión en español
Asignación y Análisis de Riesgos en APP — Manual M5 de Austral
Version 1.0 · 21 September 2026
Austral Intelligence · David Duarte Arancibia, with Mika (Austral's analysis agent)
Platform module that runs the method: Risk Platform (/risk) — with destinations in the Value‑for‑Money risk allocation (/vfm/risk, manual M1) and in the fiscal register's contract risk matrix (/faro/projects/<id>/risk, manual M2)
Languages: English (this edition) and Spanish · HTML and PDF at austral‑intelligence.com/manuals
This manual explains how to decide, risk by risk, who carries the consequence of something in an infrastructure project turning out different from what was planned — the State, the private partner, or both by a rule — and what the retained risk is worth to the State. It presents risk allocation as a self‑contained nine‑step method running through four verbs, identify, allocate, mitigate and value, with the rule that an allocation is a row in the register, a clause in the contract and a figure, and none of the three is accepted without the other two; it rates each risk on two published scales, with its framework declared for each — PFRAM's 3 × 3, which the finance ministry reads by category, and the APMG‑type 5 × 5, which the register runs row by row; and it tests the allocation against Austral's retention frontier, the quantified rule that says which transfer creates value and which destroys it, and that sets the manual's position on its one declared disagreement with practice: the two generations of Chilean tender documents — the older one, which allocates by silence with a closing clause, and the newer one, which since 2013 has named the risks the State takes and written the sharing rule by band — read as an evolution toward the method, and the manual states this as its own position, not as mere description. It walks the nine steps through the same generic regional hospital of the series, with every figure shown, procured under an availability payment; shows how the method runs on the Austral platform, screen by screen; and explains why this particular method breaks in a spreadsheet. It is written for PPP units, ministries of finance and auditors.
Austral Intelligence (2026). Risk Allocation and Risk Analysis in PPPs. Manual M5, Austral Manual Series, version 1.0, September 2026. https://austral-intelligence.com/manuals/risk-allocation/
Every figure in the worked example (section 4) and in the screenshots (section 5) is generic: it belongs to the same hypothetical 300‑bed hospital of the series, shipped as a demonstration pack (hospital_m1) in the platform, calibrated so that the method can be followed from start to finish. None of it comes from a client or from a real project, and none of it should be used as a reference for the costs, payments or risks of any actual project. The screenshots were taken on the production version current as of 18 September 2026; the version note in section 5.1 says what changed afterwards and in which figures. The quantitative tail layer uses N = 10,000 draws and seed 42, published so that a reviewer can reproduce the figure; the bands of the 5 × 5 matrix (1–4 low, 5–9 medium, 10–16 high, 20–25 critical) are an Austral convention on the grid that APMG recommends without fixing scores, and the manual declares this where it applies. The methodologies cited are credited to their authors; the only product name in the manual is Austral.
This is the first English edition of Manual M5, translated from the Spanish version 1.0 (20 September 2026). Every figure, table and citation is carried over unchanged; where the two editions differ, including after a future correction to either one, the Spanish edition is the reference.
A public‑private partnership (PPP) unit has a project that passed the eligibility filter — a hospital, a highway, a plant — and still has no contract. Before it writes the tender documents it has to decide something no earlier study decided for it: who carries what. What can go wrong in the works and in the thirty years of operation; who pays the consequence when it does go wrong — the State, the private partner, or both by a rule; what is done to make it go less wrong, and who verifies it; and how much, in money, what stays with the State is worth. On the other side of the same desk, the finance ministry has the symmetric question before it approves: what risk is left with the State under this contract, which of those risks has a clause that says how much is paid, and which does not and will show up all the same.
That is the object of this manual: the contract's risk matrix, understood not as a coloured chart but as a decision written three times — a row in the register, a clause in the tender documents and a figure in the valuation — which the manual does not accept without the other two. It is the only structuring document that precedes the other three in this series. The payment mechanism inherits from the matrix who carries demand; the public sector comparator inherits from it the retained fraction it turns into a premium; the fiscal register inherits from it which rows carry a clause and are valuable contingent liabilities. That is why most errors in the other three are born here: a risk transferred to the partner that the partner cannot manage does not disappear, it comes back — as a premium in the comparator, as a guarantee floor in the fiscal register, or as a renegotiation in the contract's third year. The maxim every guide repeats, "allocate each risk to the party best able to manage it, at a reasonable cost," is in every source in section 2 and quantified in none of them; the manual makes it operational with three questions per risk and one line, Austral's retention frontier, which states how far it pays to transfer and from where no one will take the risk at any price.
The question fits in one line: what can go wrong, who carries it, what is done to make it go less wrong, and what is what stays with the State worth?
Each part does work. What can go wrong is the identification: a catalogue by sector, one row per risk with its phase and its trigger, and also the rows that "do not apply" with the reason they do not. Who carries it is the allocation: retained, transferred or shared, and if shared, under what rule — percentage, deductible, bands, cap — because "shared" with no rule is not an allocation but a pending conversation. What is done is the rating and the mitigation: probability and impact on a named scale, before and after an action with an owner, a verifier and a date. And what stays with the State is worth are the two readings of retained risk: the expected premium that enters the comparator, and the tail — the value at risk and the expected shortfall in the tail — that the finance ministry compares with its reserve.
From this follows what the manual does not answer. It does not say whether the project is worth doing: that was decided earlier by the socio‑economic appraisal. It does not say whether it should be procured as a PPP: that is the subject of this series' Value for Money and the Public Sector Comparator manual, which receives from here the risk premium and the retained fraction. It does not say how the partner is paid: that is the Payment Mechanisms manual, which receives from here the destination of demand risk and turns it into a formula. And it does not say what fiscal commitment arises from the guarantees: that is the Fiscal Commitments and Contingent Liabilities manual, which receives from here the rows with a payment clause and values them on their distribution.
What the risk matrix is not
- It is not the payment mechanism. The matrix allocates; the mechanism pays. A matrix that says "demand transferred" next to a formula that pays per vehicle with no cap has transferred the risk on paper and retained it in the cash flow. This manual writes the matrix and shows where the mechanism honours it; how the formula is written is the Payment Mechanisms manual.
- It is not the valuation of guarantees. A retained row with a payment clause is a contingent liability: a maximum, an expected value, a schedule, and a distribution that values it. This manual identifies it, allocates it and sends it to the register; valuing it over simulated paths is the Fiscal Commitments manual.
- It is not rebalancing. What happens when a badly written row gets renegotiated — supplementary agreements, restoring the contract's economic balance — is a frontier of the method, not a part of it. The manual names it in Step 8 as the destination of silences and refers the renegotiation mechanism to the Payment Mechanisms manual.
- It is not the portfolio's fiscal risk. Adding up the matrices of many contracts — the correlation between them, the ceiling, the reserve — is a different discipline, with its own manual in this series; here it is covered in one page at the close of the method.
The matrix is written once per contract and re‑read for the contract's whole life.
In structuring: the first time. After eligibility — whose risk‑transferability criterion is the gateway into this manual — and before the payment mechanism, the comparator and the tender documents. It is the only moment when the allocation can be changed at no cost: while the matrix in the approval and the matrix in the tender documents are still the same document. The World Bank's PPP Reference Guide places it here, in structuring, with three steps — identify, allocate, translate into the contract; PFRAM 2.0 requires it before the finance ministry approves, in its eleven‑category taxonomy; the APMG certification guide puts it at the centre of the risk‑management cycle. Countries that require prior fiscal approval of each contract — Chile, Colombia, Peru — require it at this point, because after signature the allocation is no longer approved: it is either honoured or renegotiated.
In bid evaluation: the second time. Bids hand risks back to the State: a bid that asks for a guarantee, that excludes an event, that conditions the price on a deductible, is rewriting a row of the matrix. The matrix is re‑read to know which row changed and what the change is worth before awarding the contract. It is the reading that prevents the most early disputes when it is done.
With the contract signed: every time something happens. A geotechnical finding, an environmental ruling with additional measures, a change in technical standard, a force‑majeure event, a compensation claim: the matrix is re‑read to know who carries it according to the row and the clause, and the register is updated — mitigation, owner, status, alert. This is the living register: the same matrix with a date, a version and a status, which the Technical Panel and arbitration panels read when the clause was not enough.
The difference with the Fiscal Commitments manual is in frequency, unit and scope: that one runs every year, for the whole portfolio, and values what has a clause; this one runs per contract, before the clause exists, and also records what does not have one. This manual's method ends where that one's begins, and hands it two things: the rows with a clause, already allocated, and the list of the ones that do not have one.
Six readers of the same matrix, with six different questions.
For each contract, the method produces four things. None is useful without the other three.
And the fifth, which almost no one documents: the list of what the contract does not say. Every row in the register with an allocation other than "transferred" points to an article; rows with no article are risks retained by silence. Change in law in general with no threshold, force majeure with no rule on time and money, the exchange‑rate exposure of a local‑currency contract with dollar‑denominated debt, inflation transferred with a politically set cap, demand that "does not apply" because there is no user charge but that exists for the ministry's budget: these have no row in the contract; they have a row in this manual's list, with probability and impact and no money, because the absence of a clause does not make them free, and because that silence is where renegotiations are born (Austral, The Renegotiation Triangle).
There are no numeric thresholds in this section: the probability‑and‑impact scale, the premium cap, the bands of the five‑level matrix, the retention frontier's parameters and the tail's number of draws are parameters of Steps 3, 5, 6 and 7 of the method, and the example in section 4 uses them with their declared values.
The matrix is what the other three manuals inherit. The table summarises what each one receives and in which step it uses it.
| Manual in the series | What it receives from the matrix | Where it uses it | What it returns to the matrix |
|---|---|---|---|
| Value for Money and the Public Sector Comparator | The register with its probability, impact, phase and nature — specific or systematic — and the retained fraction per risk | Its Step 5 values the expected premium with the same scale and the same rate; the comparator carries it at 100% and the PPP branch only at the retained fraction; systematic risk is valued in the rate and not in the cash flow when compared at two rates | The allocation's verdict: which transfers create value (a management gain larger than the premium) and which destroy it; and the reading of the comparator that changes if the matrix changes |
| Fiscal Commitments and Contingent Liabilities | The retained rows with a payment clause — minimum‑revenue guarantee, debt guarantee, termination compensation, environmental deductible — and the list of the ones without a clause | Its Step 3 splits the list in two: the first are contingent liabilities valuable on their distribution; the second go into the contract's fiscal‑risk matrix, with probability and impact and no money | The maximum, the expected value and the tail of each guarantee, and the reconciliation of the approval's matrix with the register's |
| Payment Mechanisms | The destination of demand risk — retained, transferred, shared by band — and the allocation of inflation, exchange rate and availability | Its Step 1 chooses the mechanism family with the matrix as given: demand the partner does not control is not transferred "because it creates value"; its Step 2 writes the instrument's fiscal register | The risks the mechanism left with the State without anyone writing them down — the cap on the indexed tariff, the high tail of usage‑based payment with no cap — as new rows in the list of silences |
A consequence the Value for Money manual showed and this one explains: the same 300‑bed hospital, paid by availability, with clinical demand retained and cost overrun and life‑cycle risk transferred, has a value for money of +6.4% of the comparator at the social rate — and +5.8% at two rates — and all of that value is in the transfer of construction and life‑cycle risk; with clinical demand transferred to the partner instead, the frontier shows that the transfer destroys value — the State pays the premium and gets no management gain, because the partner does not control bed occupancy — and the verdict flips sign before anyone has written the payment formula. Section 4 walks through this with the example's matrix; the manual does not recompute the comparator, it cites it.
Three things, in this order.
A self‑contained method. Section 3 develops the nine steps — from the framework and the taxonomy to the register, the allocation, the rating, the mitigation, the premium, the tail, the test against the frontier, the clauses and the monitoring — with what goes in, what comes out, how it is computed and what the decision rule is at each one, plus a page on the frontier: the portfolio's fiscal risk, which arises when the matrices are added up. It is written to be run with any tool. Section 2 credits each rule to its source — PFRAM 2.0, the PPP Reference Guide, the APMG certification guide, the Australian guides, the Global Infrastructure Hub's sector catalogue, Irwin — and to Chilean practice across two generations of tender documents, cited by article; and it presents what Austral adds and cites as its own: the retention frontier, which turns the maxim into a figure per risk.
A reproducible example. Section 4 walks the nine steps through the 300‑bed regional hospital the series' reader already knows — the register built from the sector catalogue, the allocation justified row by row, the two scales before and after mitigation, an expected premium of 117.05 against a ceiling of 126.15 and its split into 12.59 retained by the State and 104.46 transferred, the tail of the retained book with its declared seed, the frontier's verdict per risk, the clauses and the list of silences — plus a page with the Coastal Highway from the Fiscal Commitments manual, where the matrix hands its rows with a clause to the register, and a box on the banded sharing distribution from Chile's 2023 tender documents, valued in the tail. Every figure is measured with the platform's engines and a reproducible script prints them; the manual does not write down a single one by hand, and when the engine cannot measure something, it says so.
The tools that run it, and that the client keeps. Section 5 shows how the method runs on the Austral platform: on the Risk Platform, where risk is identified from the sector catalogue, allocated with a justification, rated on the two scales, mitigated with an owner and a status, verified and monitored, with the tail's quantitative layer and the retention frontier available through the API; and on the three screens of other modules where the same register ends up — the comparator's risk allocation, where the premium is valued; the contract's risk matrix in the fiscal register, where the risk with no clause sits next to the commitment; and the financial model's renegotiation. Section 6 explains why this particular method breaks in a spreadsheet, with seven failures measured on section 4's example. Section 7 collects the references with their verification status.
Anyone who just wants to know whether the matrix they received for approval is complete can go straight to the reviewer's checklist at the close of section 3: declared taxonomy; register with phase and trigger; allocation with sharing rule and justification; two named scales, before and after; mitigation with owner and verifier; premium with published scale and cap; tail with distribution, number of draws and seed; frontier verdict read as an order; clause per row and list of silences; version.
Every rule of the method in §3 has behind it a guideline a ministry applies, a contract that wrote it, a discrepancy that tested it, or a paper that explains it. This section says where each one comes from, with section, article or discrepancy number, so that a reviewer can argue the rule at its source and not in the manual. Five layers: the three primary sources, which give the fiscal taxonomy and the finance ministry's reading (PFRAM 2.0), the place in the cycle and the three allocation criteria (the World Bank's PPP Reference Guide) and the risk‑management cycle with its checklist (the APMG certification guide); the practice guides that fixed what is transferred in each sector and how it is written — the Australian commercial principles, the GIH's sector‑by‑sector allocation tool, Irwin on the why, the World Bank's model contractual provisions, the OECD and EPEC; country practice, with Chile read in its tender documents and in the Technical Panel's rulings; what Austral adds and cites as its own, the retention frontier; and table 2.7, which links every step of §3 to its source and to the §5 screen that runs it.
A reading warning. The sources agree on four things: that risk allocation is the first act of structuring, and that the payment mechanism, the guarantees and the compensation clauses are derived from it; that the rule is to allocate each risk "to whoever can best manage it," with Irwin's three criteria as its precise form; that the working instrument is a register with probability and impact on a qualitative scale, before and after mitigation; and that the contract has a closing clause under which any risk not expressly allocated stays with the private partner. They do not agree on four things: whether general change in law is shared by threshold, retained, or transferred (the Australian principles share it in three bands in social infrastructure and give no relief in economic infrastructure; the British standard splits it by phase and type of expenditure; the World Bank documents all three practices); whether force majeure gives time, money or termination (the Anglo‑Saxon guides treat it as a relief event with conditional payment; Chilean tender documents give time and deny repair); whether retained risk with no clause is valued or only listed (PFRAM rates it and does not value it; the Reference Guide refers to the comparator guides; none quantifies it in the same register); and whether the rating scale is 3 × 3 or 5 × 5 (PFRAM uses the first for the finance ministry; APMG, following HM Treasury, allows both and sets no numeric bands). The manual takes a position on each point — general change in law is shared by bands and specific change in law is retained; force majeure gives time and insurance pays for the works, unless the contract says otherwise; retained risk with no clause is valued on the same scale as retained risk with a clause; the two scales coexist under their own names and what is compared is the order — and presents it as a decision, not as consensus. The manual's four verbs (identify, allocate, mitigate, value) and the retention frontier are Austral's own formulation; none of these sources carries the second, and the manual does not attribute it to them.
The PPP Fiscal Risk Assessment Model 2.0 (IMF and World Bank, September 2019) devotes §III.E, "Fiscal Risks Matrix," to the matrix this manual takes as its backbone. Its starting point is the same as §1's: "risk allocation is a central piece of PPP contract structuring; the basic principle is that each risk should be allocated to the party best able to manage it"; "in principle, a PPP contract should define a complete allocation of project risks," and on that basis "the contracting authority's contract manager should create a risk matrix and a risk register, documenting the assessment of probability and impact." And it adds what distinguishes the fiscal reading from the contractual one: fiscal risks can also arise from risks not identified or not clearly allocated in the contract — the partner with no management capacity that goes bankrupt; changes to the project and the contract "especially if not triggered by the private partner," where "the private partner always has more bargaining power than the public one." This is §1.4's fifth deliverable, the list of what the contract does not say, written by the finance ministry.
The matrix has eleven categories and 52 subcategories (table 1 and annex I): 1 governance (3 detailed risks), 2 construction (19), 3 demand (10), 4 operation and performance (7), 5 financial (4), 6 force majeure, 7 material adverse government action (MAGA), 8 change in law, 9 financial rebalancing (3), 10 renegotiation and 11 contract termination (2); categories 6, 7, 8 and 10 have no subcategories. For each one the tool "poses questions that let the user assess whether the risk is relevant to the specific project": this is the question bank for Step 1 and for the §5 fiscal‑risk screen. The process has six steps (figure 6): identify, estimate probability, estimate fiscal impact, rate, record mitigation and prioritise; the analyst fills in the first three and the fifth, the tool computes the fourth and the sixth. Probability is read on three levels — low ("very unlikely but not negligible; would require very unusual circumstances"), medium ("likely and possible; with precedents") and high ("very likely, almost certain; extensive precedents") — fiscal impact on three levels with thresholds set by the country as a percentage of GDP (low, less than X; medium, between X and Y; high, more than Y; in the manual's example X = 0.1% and Y = 0.2% of GDP), measured on "the government's deficit and gross debt" and complemented by reputational damage, service availability and operations. The rating is the product (figure 7): low × low = irrelevant; low × medium and medium × low = low; low × high, medium × medium and high × low = medium; medium × high and high × medium = high; high × high = critical. Priority crosses rating and mitigation (figure 8): an irrelevant risk never triggers action; without mitigation, low calls for medium priority, medium and high call for high priority and critical calls for "critical" action; with mitigation, low drops to low priority, medium and high to medium and critical to high. And the management rule Step 4 picks up: "not every risk deserves attention, and some loss to government is not only to be expected but is admissible, depending on the cost of fixing the problem"; priority risks are resolved "by changing the project design to avoid the risk — only before contracting —, by introducing additional mitigation measures, or by creating fiscal space to absorb the cost if the risk materialises."
What PFRAM does not do, in PFRAM's own words (§II.B): it does not judge whether the project is worth doing or whether it should be a PPP, it does not replace project appraisal or cost‑benefit analysis, and — what matters here — it does not price retained risk with no clause: the matrix rates and prioritises, and money enters the fiscal accounts only through the direct commitments and guarantees of §III.C ("Government Support to PPPs"), which M2 develops. Step 5 of this manual fills that gap with M1's scale, and Step 6 with the tail. Two clarifications for the reviewer. First: the manual cites the 2.0 edition (2019); the platform additionally loads a question bank with a third answer ("yes, but not for climate") taken from PFRAM's ongoing revision, which is not published, and the manual presents it as a platform extension, not a source. Second: the rating and priority labels the screen shows ("low relevance" for "irrelevant"; "accept / monitor / plan mitigation / act urgently" for PFRAM's five levels) are a platform paraphrase; the rating matches figure 7 cell for cell, and the priority differs in one cell — unmitigated medium is "high priority" in PFRAM and "monitor" on the screen — which §5 declares.
Table 2.1 — PFRAM's eleven categories and what the manual does with each. The column reading is Austral's own: PFRAM says what happens to the State; the GIH catalogue (§2.4) says what can go wrong; the Chilean tender documents (§2.5) say where it was written.
| PFRAM category | Subcategories | What the finance ministry looks at | Step in §3 where it lives | GIH sub‑risks that feed it |
|---|---|---|---|---|
| 1 Governance | 3 | Legal framework, institutional capacity, coordination | Step 0 (framework); Step 9 (checks) | — (not a contract risk) |
| 2 Construction | 19 | Cost overrun, delay, land, permits, design, variations | Steps 1–4; Step 8 (land, environmental ruling, utility relocation, technical standard) | Land and site · social · environmental · design · construction · variations |
| 3 Demand | 10 | Revenue lower than forecast; revenue guarantees | Step 2 (frontier); Step 7; M4 | Demand |
| 4 Operation and performance | 7 | Availability, quality, operating cost | Steps 3–4; Step 8 (service levels) | Operations · condition at termination · disruptive technology |
| 5 Financial | 4 | Rate, exchange rate, inflation, refinancing, insurance | Step 2; Step 6 (tail); M2 | Financial markets · insurance |
| 6 Force majeure | — | Time, money or termination | Step 8 | Force majeure |
| 7 Material adverse government action (MAGA) | — | Acts of the State itself that damage the partner | Step 8 | MAGA · strategic / counterparty |
| 8 Change in law | — | General, specific, discriminatory | Step 2; Step 8 | Change in law |
| 9 Financial rebalancing | 3 | Clauses that restore the equation | Frontier (M4) | — |
| 10 Renegotiation | — | Changes not triggered by the partner | Step 9 (matrix version) | — |
| 11 Termination | 2 | Termination grounds and payments | Step 8; M2 | Early termination |
The PPP Reference Guide, Version 3 (World Bank, ADB and IDB, 2017), module 3 "PPP Cycle," devotes §3.3 "Structuring PPP Projects" (pp. 140–145) to the decision this manual develops, in three subsections that give §3's order: §3.3.1 "Identifying Risks" (p. 140), §3.3.2 "Allocating Risks" (p. 141) and §3.3.3 "Translating Risk Allocation into Contract Structure" (p. 144). The definition is §1's: "structuring a PPP project means allocating responsibilities, rights, and risks to each party in the contract"; "structuring focuses on identifying and allocating risks," because "the other elements of the structure — allocation of responsibilities and the payment mechanism — are derived from the risk allocation." This is section 1's thesis: the matrix precedes the mechanism (M4), the comparator (M1) and the register (M2).
Identify (§3.3.1). "The first step is usually to gather a comprehensive list of all risks associated with the project; this list is known as the risk register"; a risk is "an unpredictable variation in the value of the project […] arising from a given risk factor," with Irwin (2007) as the most precise definition. Risks "are usually grouped in categories associated with a function (construction, operation, financing) or a phase (termination)": box 3.7 lists ten — site; design, construction and commissioning; operation; demand and other commercial risks; regulatory or political; change of legal or regulatory framework; partner default; economic or financial; force majeure; ownership of assets — and refers to the standard lists of §3.3.2. On rating: "risk can be assessed quantitatively or qualitatively"; Infrastructure Australia's comparator guide (vol. 4) and the ADB manual give the quantitative techniques, "PFRAM identifies a broad set of risks with fiscal impact," and "in practice many agencies take a more qualitative approach": the Victoria Managed Insurance Authority's heat map and Farquharson et al.'s (2011, appendix B) sample register, where "each risk is classified as low, medium or high in probability and in impact" and "most of the effort should be directed to high‑probability, high‑impact risks." And on early mitigation, the rule Step 4 calls management mitigation: "after complete identification […] some project features or procedural steps can be adjusted: additional geological or traffic studies before the tender to reduce uncertainty and contain bidding costs."
Allocate (§3.3.2). "Allocating risk means deciding which contract party will bear the cost (or reap the benefit) of a change in project outcomes arising from each risk factor." Iossa et al.'s (2007) two objectives: creating incentives to manage risk well, and reducing the total cost of risk "by insuring parties against risks they are unwilling to bear." The central principle — "every risk should be allocated to whoever can best manage it" — and its precise form, attributed to Irwin (2007, pp. 56–62): each risk to the party best able to control the probability of its occurring ("the private party is usually in charge of construction because it has the most experience […] and must bear cost overrun and delay"); best able to control the impact, "by well assessing and anticipating the risk and responding to it" ("no one controls an earthquake, but if the private party designs, it can use techniques that reduce the damage"); and able to absorb it at the lowest cost if probability and impact cannot be controlled, which depends on "the risk's correlation with its other assets and liabilities, its ability to pass it on (to users through price, to third parties through insurance) and the nature of its ultimate bearers: government's ability to spread the risk among taxpayers can give it a lower absorption cost than a private company, whose ultimate bearers are its shareholders." These are Step 2's three questions. The Guide adds, with the OECD (2008, pp. 49–50), the warning §2.6 quantifies: "applying these principles does not mean transferring the maximum possible risk to the private sector […]; the more total risk transferred, the higher the return — or risk premium — equity investors will demand, and the harder it will be to raise debt." And the limits on allocation, which Step 2 folds in as its fourth question: the level of detail ("in practice risks are allocated in groups, with exceptions for certain significant risks: the private party bears all construction risks except certain key geological risks, against which government may indemnify it," Irwin 2007, pp. 63–65); risks that cannot be transferred ("the private party always bears certain political risks: that government breaches the contract or expropriates," mitigable with political‑risk insurance); the extent of transfer, limited by the partner's capital ("shareholders are only exposed up to the value of their stake; lenders will only accept a relatively low level of risk […]; if losses exceed the capital, shareholders can walk away from the project, and since government is ultimately responsible for the service being delivered, the rest of the risk stays with it," Ehrhardt and Irwin 2004; Iossa et al. 2007, p. 25) — this is the bankability ceiling of §2.6 said in prose — and incomplete contracts, which "must give rules (templates or formulas) for the range of foreseeable scenarios and a decision methodology for the rest." The output is the risk allocation matrix, "a list of risks — often by category — that defines who bears each one," put into practice "by including the appropriate clauses in the contract"; "some governments capture the principles in preferred allocations, generic or by sector, which are a starting point," and "matrices must be reviewed again before the contract is signed" — the Step 0 rule, one single matrix from approval to tender documents. The examples the Guide lists are §2.4's sources: Infrastructure Australia's commercial principles, the South African manual (module 4, annex 4, "a standardised matrix with typical mitigation and allocation for each risk") and the GIH's risk‑allocation report (2016 edition, twelve matrices; the platform loads the 2019 edition).
Translate into the contract (§3.3.3). The passage that justifies Step 8: "much of the literature gives the impression that, once the preferred allocation is fixed, it somehow translates smoothly into a detailed contract; that impression can be misleading." Practitioners go through "an intermediate step: who will do what and how payments will flow." The Guide proposes reaching the contract type "by considering which party can best perform the key functions (design, build, operate, maintain, finance)" and treating "the rest of the allocation as fine‑tuning: if the private party builds but the public party retains geotechnical risk, that enters the contract as an exception to the basic functional principle that all construction risks belong to the private party." And the link to payment: "if the private party better manages collection risk and demand risk, it is remunerated through user charges; if it manages collection but is not asked to bear demand, it collects and remits to the public party, which pays it by availability with a collection bonus" (M4). It closes with Irwin (2007, p. 61): "responsibilities, rights and risks should be allocated together: the logic of allocating a risk to whoever best manages it only holds if that party also receives the right and the responsibility to make the related decisions." This is Step 2's rule on the hospital's clinical demand: whoever refers patients bears the occupancy.
What the Guide does not bring: a numeric probability‑and‑impact scale or a rule for turning "high" into money; it refers to the comparator guides (Infrastructure Australia vol. 4, South Africa) and to PFRAM. Step 5's scale is M1's, and is presented as such.
The APMG Public‑Private Partnership (PPP) Certification Guide (APMG International, with the ADB, the EBRD, the IDB, the IsDB and the World Bank Group, 2016) treats risk twice, and this manual's index cited it in chapters 4 and 5 without pinning down the section; a reading of the text fixes it. In chapter 4, "Appraising PPP Projects," §4.3 "Consideration of Risk in the Appraisal Process" (p. 15) refers the cycle to chapter 5 and requires that identification "be exhaustive during appraisal, because poor identification can result in a flawed appraisal and project failure; it is good practice to develop a comprehensive risk register at this stage"; §4.4 "Estimating Risk‑Adjusted Costs" (pp. 16–17) gives Step 5's formula in its simplest form — "the simple approach is to calculate the value to be added by multiplying the probability of an additional cost by its financial impact": a pipe under the site with a 25% probability and a US$1M overrun is worth US$250,000 — the probabilistic approach "typically using Monte Carlo simulations (commonly tens of thousands of iterations)," with the caution to "conduct it only when there is reliable information on the probability of events," and the distinction M1's D28 and Step 5 adopt: "only project‑specific risks should be treated in the cost structure; systemic risks (general economic conditions) are not diversified away through portfolio strategies and are paid for only through a general increase in the asset's required return." §5.2 "Preliminary Risk Allocation" (pp. 21–22) in the same chapter defines allocation — "deciding which of the contracting agents will suffer the positive or negative financial consequences of a variation in a value from its baseline" — and lists the three mechanisms by which the contract allocates: "the revenue regime and the payment mechanism; express clauses, including guarantees and compensation obligations, which adjust the allocation implicit in the structure; and financial rebalancing clauses when certain events occur." Its box 4.4 gives the example §4 uses for the hospital: in a prison "demand is heavily influenced by legislation, sentencing policy, the courts and prison administration; transferring demand risk to the contractor would be an inefficient allocation" (New Zealand Treasury, 2009).
In chapter 5, "Structuring and Drafting the Tender and Contract," section 5 "Risk Allocation and Structuring" (pp. 73–104) is the most complete text of the three primary sources and the one that gives §3's checklist: §5.1 introduction (definition; "allocation to the private partner = transfer; to the public partner = retained risk"; the optimum; endogenous versus exogenous; allocation versus structuring); §5.2 the risk‑management cycle; §5.3 identification; §5.4 assessment (5.4.1 quantitative, 5.4.2 qualitative); §5.5 early mitigation by the authority; §5.6 deciding the allocation; §5.7 the contractual categories (compensation, relief, force majeure); §5.8 the main risks and their typical allocation; §5.9 incorporation into the contract. Eight of the method's rules come from there, almost verbatim.
First, the cycle (§5.2). "The essence of risk is two factors: the probability of the event occurring within the project period, and the financial value of its effect," and "the value of risk can be calculated with the formula risk (expected loss) = probability × impact." The cycle "includes, in sequence: identification, assessment of probability and consequences, analysis and implementation of mitigations," which "feed back into the assessment to fix the set of risks that will be the subject of allocation and, later, of structuring"; then, for retained risks, "management strategies: self‑insurance with contingency funds in the budget, insurance, hedges for financial risks, or only reactive management," and for all of them "a monitoring system that reviews the identified risks, detects new ones and establishes how to treat them, including the transferred ones, because the public partner has ultimate responsibility to the taxpayer." These are the four verbs and Step 9. Box 5.17 adds the partner's view: absorb and price it in ("premiums in the equity IRR or cost contingencies"), pass it to contractors (which "turns the risk into counterparty risk") or insure it; and it warns that "there are risks that no party, and no market agent, can take on (uninsurable ones), which the authority will have to retain."
Second, identification (§5.3). "There are multiple classifications; whichever is used, what matters is making sure all potential events are identified and treated in rating, quantification and allocation," avoiding "blind spots" and "overlaps that double‑count" (market risk that is also political when caused by a policy decision). For allocation, "identification is less exhaustive than for VfM: decisions on the significant risks, documented in the contract, implicitly allocate many minor risks." The guide works with eleven broad categories — site, design, construction, commissioning, revenues (demand and usage, price or tariff, availability and quality, third‑party revenue), maintenance, other operating risks, financial, change in law, force majeure, early termination — and its box 5.18 fixes the minimum content of the matrix: "name and category; description; effects; available mitigation measures; allocation — the party bearing the risk and the extent when shared." This is Step 1's register row and Step 2's rule that "shared" with no extent is not an allocation.
Third, the two scales (§5.4.2). Assessment for allocation "is usually qualitative, with limited exceptions," and produces "nominal (1, 2, 3…) or descriptive (high, medium, low) scales for the two dimensions: probability and the size or financial relevance of the impact"; the result is a "tolerability matrix." Its box 5.19 cites HM Treasury's Orange Book: "a high / medium / low categorisation may be sufficient and should be the minimum level, resulting in a 3 × 3 matrix; a more detailed scale may be appropriate, especially where a clear quantitative assessment is possible: in that context 5 × 5 matrices are often used, with impact on a scale of insignificant / minor / moderate / major / catastrophic and probability of rare / unlikely / possible / likely / almost certain. There is no absolute standard for the scale; each organisation must judge the most workable level of analysis." Step 3's rule — two named scales, not silently harmonised — is this one; and the clarification the reviewer should know: APMG does not fix numeric bands for the 5 × 5. The 1–25 score with bands 1–4 low, 5–9 medium, 10–16 high and 20–25 critical that the §5 screen uses is an Austral convention on the grid APMG recommends, and the manual publishes it as such. The guide closes the point with the Federal Highway Administration's (2013) priority rule — "pre‑screen the significant risks to separate them from the insignificant ones" — and with the tolerability matrix's default allocation: "the exercise focuses on the red and amber areas, assuming the default position that all green risks are transferred to the private partner unless, for some reason, it cannot manage them."
Fourth, early mitigation (§5.5). "Many risks can be mitigated by authority action during selection, appraisal and structuring: by optimising scope, the planning process, and through robust investigations that provide information on risks (and so reduce uncertainty)": archaeological maps, geotechnical studies, traffic and revenue studies, utility interference surveys, initial environmental studies. And the rule Chilean tender documents have written since 2013 (§2.5): "that information, provided as a reference, can be built into the contract to create a baseline by which some risks are allocated as they occur: archaeological findings are allocated to the private party except those not foreseen by the study; a geotechnical study fixes the baseline that defines whether an adverse condition is materially different and gives a right to financial relief." This is Step 4's management mitigation and Step 2's deductible.
Fifth, the default position (§5.6). "Risk transfer is defined by the scope of the contract and its structure: subject to fine‑tuning of the allocation, all risks inherent to the scope of the contract, and those inherent to the asset's economic ownership and the nature of the business, should be transferred unless the assessment clearly recommends otherwise"; "the most basic rule is that design, construction, commissioning, operation, maintenance, revenues and financial risks are generally the private partner's," including "some exogenous events that commonly affect the business: price volatility that affects costs, a demand change from an unexpected change in the country's growth." Risks "not naturally embedded in the scope […] are not risks faced by ordinary businesses and should be retained by the authority": the public partner's own direct acts (service changes), government acts that specifically affect the project ("a discriminatory change in law"); and "some risks can be allocated by removing obligations from the scope: lower‑demand risk in a transport project where operating the service is not in scope, or a hospital's demand where clinical services are not in the PPP." The third rule: "risks that go beyond the responsibility and capacity of both parties should be shared to a significant extent; force majeure accounts for most of these," although "even a risk entirely beyond the private party's management capacity can be transferred in part, to give it an incentive to mitigate the consequences (more resilient design)." And the list of what is never transferred entirely: force majeure, scope changes from new circumstances, discriminatory changes in law or policy, and "other government actions that negatively affect the project's economics (failure to grant approvals, payment delays, restrictions on convertibility, capricious changes imposed on the contract)" — to which note 50 gives the name PFRAM and this manual use: "some practitioners apply the term Material Adverse Government Action to these events, instead of political force majeure," because "they should be borne by the public partner, not shared, since they are under the authorities' control." The decision rule for the exceptions is §2.6's in words: "when it is clear that a transferred risk will result in a higher cost (through risk premiums) than the expected loss if government retains and manages it directly, the risk should be retained (or recovered)," and transferring "helps preserve VfM when the private partner adds value" through four capacities: "better assessing risk (calculating probabilities and estimating consequences); negotiating with third parties to pass it on at an efficient price; reducing the probability of occurrence (more resilient design, control protocols); mitigating consequences and repairing damage more efficiently." When "none of these factors is present and the event has significant potential impact, the risk should be retained." Table 5.3 gives the examples (delayed toll authorisation is shared; scope change from local interests is retained; an oil‑price rise, a construction accident, vandalism and tunnel seepage are transferred; unavailability of public decision‑makers during an election period is retained).
Sixth, the three contractual categories (§5.7). "From the contractual allocation there are different categories of risk: compensation events — the private party is entitled to financial compensation if the event occurs, to restore the financial equation or compensate the loss only in part (a shared event): full, partial or shared; relief events — the private party is excused from default with no compensation: delays from unforeseen archaeological finds; and force majeure, which can be either but which, given its relevance and international consolidation, gets its own status, also because it can lead to early termination." In civil‑law countries "force majeure is a legally defined concept, with little room for contractual adjustment," and recommended practice is "a non‑exhaustive list plus a closing definition"; note 54 adds the category the Chilean Technical Panel resolves under article 19 of the Concessions Law: "it is not uncommon in civil‑law countries for another category to be legally defined as an exception to the transfer principle: unforeseen circumstances." This is Step 8's family of clauses.
Seventh, incorporation into the contract (§5.9). "Risk allocation is implicit in the revenue regime and in the scope of obligations"; "meeting them is, generally, at the private party's risk and reward," with the exceptions "described in the contract as relief and compensation events." The contract must contain "a clear definition of the events giving rise to relief and compensation, including a precise definition of materiality thresholds; a definition (or legal cross‑reference) of force majeure; the procedures for assessing occurrence and the conditions of access — only to the extent that the impact could not have been prevented with due diligence; an 'all‑risk' clause, that is, a clause meaning that any risk not otherwise specifically described is a risk allocated to the private party; and the force‑majeure rules, including whether and how much is paid during the event, and when either party may trigger termination." The "all‑risk" clause is Step 8's general closing rule, and in Chile it has a name: "a entero riesgo" (entirely at [the concessionaire's] risk) (§2.5).
Eighth, the warning on the optimum (§5.1). "Theoretically, the optimal transfer point is where the marginal VfM of changing the allocation is negative" (figure 5.8), but "a quantitative VfM assessment must be handled with caution, because innovation and management capacity are hard to assess and some risks are by definition non‑quantifiable; for several risks the analyst will rely on common practice, precedent and judgement." APMG adds the OECD's point: "'best able to manage' can mean whoever best prevents occurrence or whoever best deals with the consequences; […] the OECD proposes transferring the risk to the party best able to bear it, that is, the one that can bear it at the lowest cost." And the concession to immature markets §2.6 formalises as a ceiling: "the optimum may not be workable in less mature PPP markets; it may be reasonable to sacrifice some VfM to secure bankability and commercial feasibility through risk‑reduction strategies, until the market matures." §2.6's frontier draws figure 5.8 and puts the ceiling on it.
Infrastructure Australia, National PPP Guidelines. The commercial principles come in two volumes, and the split between them is the first allocation decision: volume 3, Commercial Principles for Social Infrastructure (December 2008; current 2016 edition), for contracts "where government pays the private partner a fee for the availability of a facility" (schools, prisons, hospitals), and volume 7, Commercial Principles for Economic Infrastructure (February 2011), "where the private partner's revenue often comes from third parties and the private partner, therefore, bears the project's demand risk" (chapter 12 says it plainly: "the private partner earns revenue by charging users […] and therefore bears the project's demand risk"). The two volumes run through the same list of chapters — site and environmental conditions (with the distinction between high‑ and low‑risk sites, §4.4), native title and discoveries, approvals, site access, tenure, design, construction, operation and maintenance, performance regime, payments, relief events, compensation events, variations, change in law, force majeure, relocation, insurance, default, termination and termination payments, step‑in, subcontractors, change of control, expiry, disputes, refinancing gain — and are the source of Step 8's families of clauses. Three rules are quoted as they stand. Relief and compensation events (vol. 3, chs. 16 and 17): "relief events are specified events that prevent the private party from performing its obligations […], do not include events under its control […], entitle it to relief from default and from termination and, during construction, to an extension of time; the private party has no entitlement to additional costs unless the event is also a compensation event." Change in law (vol. 3, ch. 20): the general / project‑specific distinction; project‑specific — "a change in law whose terms expressly apply to the project and not to similar projects; to the facility or site and not to other similar ones; to the private party in relation to the project and not to other persons; or to companies carrying out PPP projects and not to others" (§20.3.2) — is borne entirely by government, above nominal thresholds ("of the order of A$200,000 indexed in capital and A$20,000 a year in operations, to avoid the administrative burden of small claims," note 78); a general change "is not a risk the private party can control, but in practice the private party is usually best placed to manage its effects and minimise its impact; that is why a sharing approach with thresholds that cap the private party's exposure is often the fairest form" (§20.2.2), written as a three‑band mechanism: "the private party bears 100% of the effect on capital expenditure and hard operating cost up to a first threshold; the parties share a percentage to be agreed project by project between the first and second thresholds; government bears 100% above the second" (§20.2.3), with savings shared too (§20.2.4) and no relief for soft costs, "protected by review, market testing and indexation" (§20.2.5). In economic infrastructure the rule flips sign: "the private party will only be entitled to relief or compensation for a change in law that is project‑specific" (vol. 7, §19.2.3), and "a change in law will not be project‑specific merely because its effect on the private party is greater than on other entities, nor if it is a tax change" (§19.3.3). Force majeure (vol. 3, ch. 21; vol. 7, ch. 20): defined as a list of exceptionally severe events, with relief, no compensation, and termination with its own payment if prolonged (§25.2, §26.2). The Chilean bands rule (§2.5) is the Australian §20.2.3 applied to environmental measures instead of change in law; the manual notes this because it shows that the contractual form — deductible, shared band, excess to the State — travels between risks.
Global Infrastructure Hub and Allen & Overy (2019), PPP Risk Allocation Tool, 2019 Edition. This is the source of the catalogue the platform loads by sector in Step 1 and of §5's cross‑sector comparison. Its structure, per sector matrix (eighteen, across transport, social infrastructure, energy and water; the hospital is appendix C of the social infrastructure volume): a header with the purpose ("a matrix of typical risks […] with guidance on how they are typically allocated between the contracting authority and the private partner, the rationale for that allocation, mitigation measures and possible government support"), the cautionary note ("indicative, not exhaustive; a starting point for developing the individual project matrix"), the scope (for the hospital: "design, construction, financing, operation, maintenance and transfer of a new hospital on a single site; scope may include cleaning, portering, ICT and security, but typically not clinical services, for which the authority remains responsible") and the assumptions; then a summary matrix with seventeen categories — land, access and site; social; environmental; design; construction; variations; operation; demand; financial markets (inflation, exchange rate, interest rate, insurance unavailability, refinancing); strategic or counterparty; disruptive technology; force majeure; adverse government action; change in law; early termination; handback condition; insurance — and, per sub‑risk, the allocation (public / shared / private), the rationale and the mitigation, and the comparison between developed and emerging markets. Two sentences from the hospital header support §4's allocation: "most social infrastructure projects are financed wholly or mainly by government payments because the nature of the service is not compatible with transferring demand risk" and "revenue is generated through availability payments from the authority, with deductions or penalties when the private party fails to meet availability and performance criteria." The matrix is also the catalogue with which the manual shows in Step 2 why demand is retained in a hospital and shared in a highway (the road matrix places it with the private party with an optional government backstop).
Irwin (2007), Government Guarantees: Allocating and Valuing Risk in Privately Financed Infrastructure Projects. Chapter 4, "Allocating Exposure to Risk" (pp. 47–70), is the source of Step 2 in its exact form. The principle (p. 56): "every risk should be allocated, together with the rights to make related decisions, so as to maximise the project's total value, taking into account each party's capacity to (1) influence the risk factor, (2) influence the sensitivity of the project's total value to the risk factor — by anticipating it or responding to it — and (3) absorb the risk." "It is in the spirit of the advice to allocate risk to whoever best manages it; the formulation seeks to clarify what managing a risk entails and to give a criterion — the project's total value — for judging how well it is managed." The three parts "can pull in different directions: whoever best influences the factor may not be whoever best anticipates it, and neither may be whoever best absorbs it; trade‑offs have to be made." The examples are the manual's own: construction cost overrun to the builder, "avoiding cost guarantees and setting a price that does not vary with actual cost"; expropriation cost to government, "which has the power to expropriate and may not be able to delegate it," paying the actual cost "after receiving from the partner a payment equal to the expected cost" (the land deductible); an earthquake to whoever "chooses the location or the construction methods"; demand to whoever "best forecasts and adjusts the design," if given the right to decide. Capacity to absorb depends on four things (pp. 60–61): correlation with the rest of the portfolio ("a highway's demand correlates with the local economy and therefore with government's portfolio; it may correlate less with an international company's portfolio"), the capacity to pass it on (derivatives, insurance), the capacity to spread it among ultimate bearers (taxpayers; creditors, insurers, subcontractors and shareholders) and those bearers' risk aversion. "Risks and rights should be allocated together" (p. 61): "nothing is gained by allocating demand to the partner, even if it forecasts better, if the partner has no role in deciding whether the highway gets built." Table 4.1 splits risks into four classes — project‑specific or economy‑wide, over total value or over its distribution — and table 4.2 says which part of the principle governs in each: for economy‑wide risks "the first part barely applies; the focus must be on anticipating, responding to or absorbing." And transaction costs (pp. 63–65): "in principle risks can be subdivided almost infinitely […]; at some point the transaction costs of ever‑finer subdivisions exceed the benefits of better management." Chapter 5 applies the principle to three risks — exchange rate, insolvency and political risk — and chapter 7 values the exposure: M2 rereads it for guarantees; this manual takes the rule from chapter 4 and the lesson §2.6 formalises from chapter 5, that a risk the partner cannot manage comes back to the State as a guarantee "with a name or without one."
World Bank (2019), Guidance on PPP Contractual Provisions, 2019 Edition. This is the guide to the clauses where the allocation is written, and Step 8 refers to it family by family: 1 force majeure (§1.1 key aspects; §1.3 uninsurability), 2 adverse government action (§2.1: events that "delay or prevent the private party from performing, or have a material adverse financial impact, and are under government's control or are better managed by it, and are therefore allocated to it"; "transferring MAGA risks to the private party has two consequences: at minimum a high premium that can make the project unaffordable, or simply make it unattractive or unbankable"), 3 change in law (§3.1: "without a specific clause, change‑in‑law risk would remain entirely with the private party, because it contracted a service at a price"; §3.2.3, the three approaches: (a) all risk on the authority, "sometimes the only way to raise private financing in the jurisdiction"; (b) basic sharing by an annual threshold below which the private party is not compensated, "acceptable to lenders because it makes the risk quantifiable" — the Philippines; (c) a distinction between general and discriminatory change, noting that "in mature markets the private party accepts more general‑change risk but expects the authority to bear general changes requiring capital expenditure once the asset is built, and discriminatory changes"), 4 and 7 step‑in rights, 5 refinancing, 6 termination events, 8 termination payments (§8.3 for authority default, MAGA, change in law or voluntary termination; §8.4 for private‑party default; §8.5 for force majeure), 9 asset reversion (§9.3 residual‑value risk), 10 confidentiality and transparency, 11 governing law and dispute resolution. The 2019 edition added to the 2017 edition the chapters on termination, termination payments, reversion, transparency and bond financing; the 2017 edition expanded the 2015 Report on Recommended PPP Contractual Provisions, which is APMG's reference (note 50) for the MAGA term.
OECD (2012), Recommendation of the Council on Principles for Public Governance of Public‑Private Partnerships (adopted 4 May 2012). Principle 6: "transfer risks to those best able to manage them: risk must be defined, identified and measured, and be borne by the party for which it is cheapest to prevent the risk from materialising, or for which the materialised risk is cheapest to bear." This is the maxim in its official OECD form, with the two costs — preventing and bearing — that §2.6's frontier separates as m and p. Principle 8 adds the renegotiation rule M4 and Step 9 use: "only if conditions change due to discretionary public‑policy actions should government consider compensating the private sector." The analytical precedent is OECD (2008), Public‑Private Partnerships: In Pursuit of Risk Sharing and Value for Money, which the Reference Guide cites (pp. 49–50) and which gives the endogenous/exogenous risk definition APMG discusses.
EPEC (2011), The Guide to Guidance: How to Prepare, Procure and Deliver PPP Projects. §1.2.2 "Risk allocation" fixes the cycle in five stages — identification, assessment ("the probability of identified risks materialising and the magnitude of their consequences"), allocation ("to one of the contract parties, or agreeing to treat the risk through a specific mechanism that may involve sharing it"), mitigation and monitoring and review — and places the detailed risk register among the key tasks of detailed preparation, before launching the tender; the guide treats the matrix as a preparation document that "is refined during the tender phase." Its box 2, on traffic risk, is the European counterpoint to Step 2's demand rule.
The British standardised contracts. The Standardisation of PF2 Contracts (HM Treasury, December 2012) — successor to SoPC4 (2007) and read for M4 — writes the allocation in three chapters Step 8 cites: chapter 15, "Supervening Events" (§15.2 compensation events, §15.3 relief events, §15.4 force majeure), chapter 16, "Change in Law," and chapter 17, "Insurance." The change‑in‑law rule (§16.6) is the third the manual compares: "the costs of discriminatory and specific changes in law not foreseeable at signature, whether or not they involve capital expenditure, are borne by the authority in construction and in operation" (§16.6.1); "the costs of general changes in law during construction are the contractor's risk, whether or not it knew of the change at signature" (§16.6.3); "general changes that take effect during the service period and were not foreseeable are the authority's risk if they involve capital expenditure and the contractor's if not" (§16.6.4), with an indexation escape valve for operating costs (§19.11). Chapter 17 additionally gives the only sharing rule for a financial risk the manual finds in a standard: the insurance‑premium sharing schedule (§17.8), under which premium variations above a band are shared between the authority and the contractor, and the treatment of risks that become uninsurable (§17.9), which pass to the authority or to termination.
Table 2.5 — Where the matrix lives and how four risks are written. Clauses and guidelines only, never performance figures or pending claims.
| Country | Where the matrix lives | Taxonomy | Change in law | Force majeure | Demand |
|---|---|---|---|---|---|
| Chile | In the tender documents, as a "Risk distribution" article (since 2013) and a general closing rule; not as a matrix annex | By clause (land, environmental, utility relocation, geotechnical, minimum revenue guarantee, force majeure, termination) | No general clause; the standard in force at bid time is the concessionaire's; the change in technical standard after award is resolved under article 19 of the Concessions Law and the Technical Panel | "Caso fortuito o fuerza mayor" [act of God or force majeure] (Civil Code, art. 45): time with no compensation; the Treasury does not contribute to repair; mandatory catastrophe insurance | Transferred by design and absorbed through time (net present income ≥ investment reference cost), or shared with a minimum revenue guarantee and co‑participation; retained in hospitals and prisons (fixed and variable operating subsidies) |
| United Kingdom | Standardised contract (PF2): compensation, relief and force‑majeure events | By clause | General: contractor during construction, authority if it requires capital during operation; specific and discriminatory: authority | Its own event; termination with payment if prolonged | Retained (unitary availability charge) |
| Australia | National commercial principles (vol. 3 social, vol. 7 economic) + project matrix | By contract chapter | Social: general shared in three bands, specific to government; economic: only the specific | List of exceptionally severe events; relief with no compensation; termination with its own payment | Retained in social; transferred in economic (with documented traffic shortfalls) |
| Colombia | Risk matrix as a structuring requirement (Law 1508, art. 11.5) and a contract annex; contingent‑liability valuation by the finance ministry (Law 448 of 1998; art. 26.7) | Land, environmental, utility networks, demand, tax change in law, general change in law, force majeure | By matrix: general to the concessionaire with tax exceptions | Insurable to the concessionaire; uninsurable shared or to the State | Shared with a revenue differential (4G programme) |
| Peru | MEF allocation guidelines (RM 167‑2016‑EF/15) + per‑contract matrix and risk report | 18 design‑and‑construction risks, 9 operation risks | "Regulatory or legal risks" (1.17, 2.6): recommended practice per risk | Insurable to the concessionaire; uninsurable shared | By project: co‑financed (retained) or self‑sustaining (transferred with guarantees) |
| South Africa | Module 4 of the PPP Manual: standardised matrix with typical mitigation | By risk | By matrix | By matrix | By matrix |
Chile is the country this manual reads in its own documents, and what it finds is that risk allocation was written in two generations of tender documents that coexist in the corpus. The thesis is Austral's own; the articles are the tender documents'.
The first generation allocates by silence, with a closing clause. The tender documents for the Maipú and La Florida Hospital concession (2009) have no risk‑distribution article; they have Chilean practice's general rule, which is APMG's "all‑risk" clause in three words: the works "shall be carried out at the entire risk of the Concession Company, which shall bear whatever expenditures are necessary until their full completion," including "the relocation, transfer and modification of electrical, telecommunications and sewerage lines and water mains and, in general, all expenses and works that may be necessary" (art. 2.5.13, "Responsibility, care of the works and risks"). Force majeure is defined by cross‑reference to article 45 of the Civil Code (definitions, no. 27) and treated in the suspension article (art. 1.11.1): the parties assess the damage and agree how to contribute to remedying it, with the Conciliation Commission if there is no agreement; "in the event of destruction of the works during construction, the Concessionaire shall be obliged to repair them fully, with no right to reimbursement," charged to the catastrophe insurance (art. 1.8.11: for the full value of the works, maximum deductible 2%, the MOP [Ministry of Public Works] as sole beneficiary, in force until provisional commissioning; art. 36 of the Concessions Law Regulations), and "the qualification of an act of God or force majeure […] shall be made by the Director General of Public Works […] and the Treasury shall not contribute to the repair of the damage." Demand is retained by the design of the payment mechanism (a fixed operating subsidy; a variable payment per bed‑day, art. 1.12.3.3; M4); performance is not deducted, it is fined under the table in art. 1.8.5.1 and bonused according to the Service Level Determination Mechanism of art. 1.10.17 (Service Result, incorporated by Clarifying Circular no. 1 — which is why it does not appear in the tender documents' base text, where chapter 1.10 ends at 1.10.16; the award decree, MOP Supreme Decree No. 230/2009, cites it three times), whose Service Result enters as a term in the variable subsidy formula of art. 1.12.3.3 (M4), and the only risk the tender documents name as "distributed" is financial: Clarifying Circular no. 1 added art. 1.12.13, "Option to distribute financial risk in the event of early termination of the concession for serious default," an optional mechanism offered in the bid under which, after a re‑tender under article 28 of the Law, the Ministry of Health pays the concessionaire (or the assignee of its cash flows) the difference between the present value of the unpaid construction‑subsidy instalments and the re‑tender proceeds when the latter is lower, and the concessionaire pays the Ministry 80% of the difference when it is higher (arts. 1.12.2.3 and 1.12.3.4). This is a guarantee of the construction subsidy against termination for default, written as "risk distribution," and it is the first lesson of the older generation: the risk the lender will not accept at any price — collecting the subsidy if the contract collapses — comes back to the State with a clause, even though the rest of the contract says "entirely at risk" (§2.6, bankability ceiling).
The second generation adds a "risk distribution" article with banded mechanisms, and begins in 2013. Clarifying Circular no. 2 of the tender documents for the Puente Industrial Road Concession (12 September 2013) added two articles that became the model for everything that followed: art. 1.12.8, "Coverage for cost overruns from additional measures arising from the project's Environmental Qualification Ruling" — the concessionaire performs all environmental measures "entirely at its own charge, cost and responsibility," but if the ruling is issued after bids open and sets additional measures, "the Concessionaire shall bear up to UF 30,000 for such overruns" (and reinvests in the works any difference if it spends less) and the excess "shall be deducted in the calculation of net present income," valued by two university studies, one chosen by each party, with the Technical Panel if there is no agreement — and art. 1.12.9, "Coverage for construction cost overruns on the bridge piles over the Bío Bío river": "cost overruns shall be deemed to exist […] when the final average depth of all piles built, not including the abutments, exceeds 30 metres," with the overrun deducted from net present income and the condition that the concessionaire not reduce pier spacing or increase the number of piles relative to the reference baseline. This is APMG's geotechnical baseline (§5.5) written into a Chilean tender document, and art. 1.8.17.2, letter b), names it: "Risk distribution between the MOP and the Concessionaire," with existing‑utility relocations above UF 40,000 also deducted from net present income. All three mechanisms share the same contractual form: a deductible for the concessionaire, the excess to the State, and the State pays through time — by deducting from the present value of the revenues that extinguish the concession — not through cash. The tender documents for the Route 78–Route 68 Link (2017) repeat it as a concessionaire option within 60 days of the environmental ruling (art. 1.12.7.2: a UF 20,000 deductible and the excess to net present income), and DGC Resolution no. 14 of 2019, which approves the standard tender‑document template for the Second Healthcare Facilities Concession Programme, generalises it for hospitals: art. 1.12.11, "Risk distribution for coverage of the costs of additional environmental measures during the construction stage," with the 60‑day option between bearing it all or a three‑band split — deductible, a shared band at the percentage set in the Supplementary Annex, and the excess to the Ministry of Health — the two university studies and the Technical Panel; art. 1.12.10, the financial‑risk distribution option inherited from 2009; and art. 2.5.11, "entirely at risk," unchanged. The corpus shows the same article in the tender documents for the Biobío, Maule, O'Higgins and Los Ríos–Los Lagos hospital networks, the National Cancer Institute, Santiago's Orbital Sur, Route 5 Chacao–Chonchi, the Route 78 re‑tender, the second Route 68 concession, the Coquimbo desalination plant and the Copiapó and Calama prisons: it is a change of programme, not of a single contract.
The mature form: the Acceso Norte a Concepción (Concepción Northern Access) Concession tender documents (2023). The tender documents for the second concession of the Ruta del Itata — approved on 1 August 2023; the manual calls it "Itata" for brevity and "Acceso Norte a Concepción" when citing it — write the allocation in a named article, 1.13.3 "Risk distribution," which opens with the general rule in its most complete form: "the Concession Company must bear all risks that determine the positive or negative profitability of the Concession Contract […]. The Concession Company may not request compensation or indemnification of any kind, nor a review of the Concession Contract, upon the occurrence of foreseeable or unforeseeable supervening events that affect the positive or negative profitability of the Concession Contract. The following subordinate articles establish specific mechanisms by which the State assumes certain risks of the concession." The subordinate articles are the matrix: 1.13.3.1, minimum revenue guarantee, "does not apply to this project" — a recorded decision, not an omission (Step 1); 1.13.3.2, additional environmental measures from the environmental ruling during construction, in three bands and with no option: the concessionaire bears it "entirely at its own charge" up to UF 236,000 (reinvesting the difference if it spends less), the next band of UF 100,000 reimbursed by the MOP at 50%, and the excess above UF 336,000 reimbursed in full by the MOP within 120 days of the site inspector's approval, with the two university studies and the Technical Panel if there is no agreement; 1.13.3.3, existing‑utility relocations, also in three bands: up to UF 100,000 from the concessionaire (deemed already remunerated by the contract; if it spends less, 80% of the difference is reinvested), the next UF 50,000 shared 50% with reimbursement within 180 days, and the excess above UF 150,000 "deducted from net present income" — the 2013 form, kept for the top band. The rest of the matrix lives in its own clauses: land, with the MOP on a schedule — "handover of 80% of the necessary land within 17 months and 100% within 21 months" from approval of the expropriation records, conditional on the concessionaire having the environmental ruling 60 days earlier, and with 3‑ and 6‑month periods if it obtains it later (art. 1.8.2.3); force majeure, with the concessionaire and its insurance: delays "caused by force majeure or by acts or omissions attributable to the MOP" give an extension of time, but "when the delay arises from a force‑majeure event, the extension of one or more time periods shall give the Concessionaire no right to compensation or indemnification of any kind" (art. 1.11.3); under suspension, "in the event of destruction of the works […] the Concessionaire shall be obliged to repair them fully with no right to reimbursement," collecting on the "catastrophe insurance" of art. 1.7.6.4.2 and of art. 36 of the Regulations, and "the Treasury shall not contribute to the repair of damage caused by an act of God or force majeure" (art. 1.17); termination by unilateral MOP decision "for reasons limiting the proper operation of the works, or regional development, or because it deems it necessary to raise the technical standard or service levels, or for other reasons of public interest," only after 24 years or when net present income exceeds 70% of the investment reference cost, with the Finance Minister's approval (art. 1.18.1.4), and extinction upon reaching total revenue targets (art. 1.18.1.1), which absorbs demand through time. And change in law prior to the bid, which the clarifying circulars resolve as compliance with "environmental regulation in force": asked whether Law 21,600, which created the Biodiversity and Protected Areas Service and expanded native‑forest preservation categories, would give a right to time or compensation, the MOP answered that it "constitutes the environmental regulation in force that the Concession Company must take into account," entirely at its own charge, "with the sole exception of applying, where applicable, the risk‑distribution rules on environmental matters set out in article 1.13.3.2" (Clarifying Circular no. 5, answer 174).
What the Technical Panel resolves, and no generic matrix names: change in technical standard. Two public rulings, cited by number and holding, mark the boundary between transferred design risk and retained change of standard. In Discrepancy D04‑2019‑15 (MOP with Sociedad Concesionaria Puente Industrial, "for requirements arising from the Seismic Risk Study"), the Panel recommended on 8 August 2019 that "the requirements arising from the Seismic Risk Study required for the project's design constitute an increase in the seismic safety standard applicable to the construction of Puente Industrial and the contract's other structures" — a supervening act of authority, under the terms of article 19 of the Concessions Law — that "for the recognition and payment of any cost overruns by the MOP, the Concession Company must prove, where applicable, the significant alteration of the contract's economic and financial balance," and that "the amount of any such compensation must be rigorously substantiated" (paragraphs 11.1–11.3). In Discrepancy D15‑2020‑17 (Sociedad Concesionaria Nuevo Complejo Fronterizo Los Libertadores with the MOP, "for higher costs of the Control and Services Building due to snow load"), the Panel recommended on 31 December 2020 "not to compensate any of the matters claimed": the standard applicable at the project date was NCh 431‑77, which requires the designer to "verify the actual snow conditions at the site," and the tender documents required the load "based on the standard and the measurements taken in the field" — two cumulative conditions — such that the higher load requested by the site inspector was not a change in standard but the contract's own standard. The pair is Step 8's rule on technical standard: which version of the standard governs, and who pays for a change — the standard in force at bid time, and the site measurements the standard requires, are the concessionaire's; the standard the authority raises after award is the State's, under article 19, against proof of the imbalance. Neither ruling is quoted here for figures.
What the two generations show. The general rule — "entirely at risk," "no compensation for foreseeable or unforeseeable supervening events" — has not changed in fourteen years; what changed is that the newer tender documents name the risks the State takes and write the sharing rule (deductible, shared band, excess, and what it is paid with: cash or time), with a valuation procedure and a technical forum for disagreement. The second generation is, in this manual's reading, Chilean practice moving toward the method: one row, one clause, one figure. Two limits on that reading, stated so as not to overstate it: the bands cover three construction risks (environmental, utility relocation, geotechnical in one case) and do not touch force majeure, change in law or technical standard, which are still resolved by the general rule, the Regulations and the Panel; and the deductible amounts (UF 20,000 in 2017, UF 236,000 in 2023) are not derived from a published risk valuation, but from each set of tender documents' own negotiation, which is exactly the gap Steps 5 and 6 fill.
United Kingdom. The matrix lives in the standardised contract, today the 2012 PF2, as three lists — compensation events, relief events and force majeure (ch. 15) — and a change‑in‑law chapter (ch. 16) with the by‑phase, by‑type‑of‑expenditure rule quoted in §2.4. The National Audit Office's assessment (PFI and PF2, 2018) is §1's evidence on what the State ended up paying when the allocation on paper was not the allocation in the contract; the PF2 programme was closed to new projects in 2018 and is cited as a method.
Australia. The national commercial principles are a published preferred allocation, with the social/economic split as the first decision and change in law as the best‑written risk (three bands in social; only the specific in economic). The traffic shortfalls of Australian toll roads in the 2000s are the warning the Reference Guide and APMG cite on badly transferred demand risk, and the reason volume 7 declares it the private party's with no government backstop: the manual names them as a documented episode, with no figures.
Colombia. Law 1508 of 2012 defines a PPP as a contract "that involves the retention and transfer of risks between the parties" (art. 1), requires that projects "have an efficient risk allocation, attributing each one to the party best able to manage it, seeking to mitigate the impact its occurrence may have on the availability of the infrastructure and the quality of the service" (art. 4), places among the structuring requirements "the adequate characterisation, estimation and allocation of risks, possible contingencies, and the corresponding risk matrix associated with the project" (art. 11.5), and conditions future budget commitments on "prior approval of the risk and contingent‑liability valuation by the finance ministry" (art. 26.7), under Law 448 of 1998. This is the country where the matrix is a mandatory approval document and where the finance ministry values it before signature: the register → valuation → approval circuit of §1.3, written into law. The risk‑allocation policy guidelines (CONPES 3107 and 3133 of 2001) and the sector‑type matrices of the National Infrastructure Agency (land, environmental, utility networks, demand with a revenue differential, tax change in law) are the practice.
Peru. The Ministry of Economy and Finance's Guidelines for the allocation of risks in Public‑Private Partnership contracts (Ministerial Resolution 167‑2016‑EF/15, of 30 May 2016; updated to the framework of Legislative Decree 1362 and its regulations) are the national guideline closest to Step 2's format: for each of 18 design‑and‑construction risks and 9 operation risks — design, construction, land expropriation, geological/geotechnical, utility interference, environmental, archaeological, permits, existing infrastructure, additional investment, early termination, financing, inflation, interest rate, exchange rate, force majeure, regulatory, accidents; demand, operating cost overruns, extraordinary maintenance, political — an identification, a recommended practice for allocation and the mitigation mechanisms, with the rule that "there is no single allocation […]; if the OPIP [Public Investment Promotion Body] decides to depart from the recommended practice […] it must justify its decision in the Risk Report" and that "risks shall be allocated to the party with greater capacity to manage them, for which the project's risk profile must be considered." On geological risk, which the manual uses alongside Puente Industrial's art. 1.12.9: "some projects may present a geological complexity that makes it very hard for the concessionaire to bear the whole risk (underground works or tunnels); in these cases the risk may be retained wholly or partly by the grantor, for example by focusing on sections or stages," with "reliable studies […] that must yield a monetary quantification of the risk," "the concept of a geological event and its payment mechanism," and "sharing mechanisms […], for example through a band scheme."
South Africa. Module 4 of the National Treasury's PPP Manual (2004) is the standardised matrix with typical mitigation and allocation the Reference Guide cites, and the probability × impact register M1 adopted; it is cited via M1 and not reread here.
Where they part ways. Whether the matrix is a contract annex (Colombia, Peru, Australia per project), an internal approval document (United Kingdom, with the standardised contract as the matrix) or an article in the tender documents plus a closing rule (Chile); whether general change in law is shared by threshold (social Australia, the Philippines), split by phase and expenditure (United Kingdom), transferred (economic Australia) or unwritten (Chile); whether force majeure gives time (Chile), relief (Australia, United Kingdom) or money and termination (all three, to varying degrees); and whether demand is transferred (economic Australia; Chile through extinction on net present income), guaranteed (Chile with a minimum revenue guarantee; Peru self‑sustaining; Colombia with a revenue differential) or absorbed through time (Chile).
The maxim every source in this section repeats — each risk to whoever can best manage it, at a reasonable cost — is, in the paper's own words, "the most quoted and least quantified rule in the doctrine." Austral, The Optimal Risk‑Retention Frontier (§§2–6 and 9; appendix C), turns it into a figure per risk, and that is the framework for Step 2, Step 7 and the manual's position on the four disagreements of the opening warning.
The frontier (§2). For a class of risk, the State retains a fraction α and transfers τ = 1 − α. Three costs move with the transferred fraction: the transfer premium P(τ), what the partner charges above the risk's actuarial cost — which arises from a financing friction: whoever bears the risk at financial close is a special‑purpose vehicle with non‑recourse debt, unable to diversify project‑specific risk, and charges for it; the management value M(τ), what the transfer creates by giving the partner an interest in managing the risk — high for controllable risks (construction, operation) and close to zero for macro risks, which the partner does not manage however much it is paid; and the sovereign retention cost R(α), what the State spends bearing the retained fraction — its own risk‑adjusted expected loss plus the fiscal‑space charge for the contingent liability it creates. Minimising the social deadweight loss gives a line: α* = p / (p + 2m + r). Efficient retention rises with the premium p (the more it costs to push a risk onto the partner, the more the State should keep) and falls with the management value m and the sovereign cost r; the crossover — retaining half — is at p = 2m + r. The order it produces is the quantified maxim: project risks (low p, high m) fall near α* = 0, transfer; macro risks (high p, m ≈ 0) fall near α* = 1, retain or share. The paper is explicit, and the manual repeats it at every step: "the precision is in the order, not in the decimals"; the closed form follows from the quadratic costs, and appendix E shows the order and the verdicts survive other functional forms.
The two halves of "best able" (§3). m is the management half; p is the bearing half. "The doctrine's error is assuming they move together — that whoever should manage a risk should also bear it. For project risks that holds; for macro risks they come apart," and the bearing half is where the sovereign's advantage lies, for two reasons: Arrow and Lind's (1970) — the State spreads the variance across all taxpayers and its social premium tends to zero — and the ruin asymmetry: a loss that exhausts the special‑purpose vehicle's capital bankrupts it, and its premium for a tail risk carries a survival term the sovereign does not, because the sovereign dissolves the same loss across taxpayers and across generations. This is the precise form of Irwin's third question — who absorbs more cheaply — and of APMG's fourth capacity.
The bankability ceiling (§4). Project debt has to be investment grade; "push enough risk onto the vehicle and its debt falls below that threshold: at that point the debt market does not charge more, it closes." There is, for each risk, a ceiling τ_max, the maximum fraction the private party will bear at any price; the constrained efficient retention is α* = max(p/(p + 2m + r), 1 − τ_max), "so that retention can be forced above the efficiency optimum by pure feasibility." An observed allocation that transfers more than the ceiling "is not merely inefficient: it is infeasible; the private sector will not bear it, so in practice one of two things happens: a guarantee fills the gap — a minimum‑revenue guarantee that brings demand back under the ceiling, political‑risk insurance, the sovereign bridge of indexation — or the project does not reach financial close. This is why the guarantee architecture exists: a guarantee is not a subsidy bolted onto a risk transfer; it is the State retaining the part of a risk that was above the bankability ceiling, so that the rest can be financed." This is Step 2's fourth question, Step 7's bankability reading and Step 8's bridge to M2; and it is what article 1.12.13 of the Chilean hospitals wrote in 2009 without the theory.
Fiscal space (§5). "Retaining is not free, and the frontier must not pretend it is": the retained fraction is a contingent liability that gets counted (Austral, The Recognition Rule), and r carries the fiscal‑space charge; "the dishonest version sets that charge to zero, retains everything and rediscovers the liability in the next crisis." And the subtlety Step 6 declares: the charge "is not additive across risks, because retained exposures are correlated — a macro shock calls the exchange‑rate guarantee, the demand guarantee and the revenue floor all at once" — so r rises with the correlation of the retained book (Austral, Stress‑Testing PPP Portfolios; M9), and the frontier's correlated variant picks this up.
The frontier, the cost of capital and VfM (§6). The real contribution of transferring risk i to value for money is M_i − P_i, "the management gain net of the premium paid, positive for controllable risks and negative for macro ones: transferring exchange‑rate or demand risk destroys value for money — the State pays p and gets no m; a naive comparator books it as value created, because it credits the transfer and omits the premium." Step 7's rule, and M1 Step 7's, is this: "charge the State r, the private party p, credit the transfer only with the net M − P, and the comparator stops lying." The implicit cost of capital of an allocation, r_f + Σ τ_i p_i, is the same matrix's cost‑of‑capital reading (Step 9's handoff).
The example and the anchor (§9). The paper runs through a vector of seven risks — construction, operation, demand, exchange rate, inflation, force majeure, political/change in law — with the doctrinal default allocation (transfer almost everything) and finds four misallocated: demand and inflation under‑retained, exchange rate and political risk in infeasible transfer, with political risk the case where "bankability forces retention above efficiency: the optimum is 0.81 and the ceiling pushes α* to 0.85; the State must keep 85% of a risk it largely controls, because no one else will take it." This is the example §5.5 reproduces through the API, with the calibration declared as illustrative. Its empirical anchor (§9.1) is Chilean: the cost‑of‑capital ladder by contract type as an estimate of the demand premium, and the Budget Office's (DIPRES) Public Sector Comparator for the Rancagua Penitentiary Centre (2024) read with M − P — "a prison is an availability PPP: the State bears demand, the company bears construction and operation, which it can manage; the transfer is on the right side of the crossover and the positive VfM is correct: this is the control case on the frontier, not a manipulation." Appendix C gives the eight‑class taxonomy with its efficient tendency, which is the frontier class of each row in Step 7.
What else Austral cites as its own, each in its own step: retained risk as a contingent liability that gets counted, and the discipline of not hiding it (Austral, The Recognition Rule; Steps 5 and 8); the retained part "above the ceiling" that no one wrote down — the exchange‑rate exposure a local‑currency contract with dollar debt leaves with the State (Austral, The Silent FX Liability) and inflation risk transferred with a cap (Austral, The Indexation Ceiling) — as the two most frequent silence rows in §1.4's list; a badly made allocation as the first vertex of renegotiation (Austral, The Renegotiation Triangle; §1 and Step 8); a guarantee as a priced allocation and the decision to ask a third party for it (Austral, The Third‑Party Guarantee Decision; Step 7), cited only for that decision and not for the valuation over the distribution, which is M2's rule with Duarte Arancibia (2015) as its antecedent; who decides retention within the State (Austral, From Gatekeeper to Orchestrator; §1.3); and three matrices walked end to end (Austral, Three PPPs — A Walkthrough). And the warning the paper makes and the manual repeats in Step 7: the calibration (p, m, r, τ_max) is illustrative — the premium per risk is not directly observable; a bid gives a total IRR, not a decomposition — and the robust result is the order, not the figure.
A contradiction, stated as such. The Reference Guide (§3.3.2) and APMG (§5.6) allow that in immature markets "it may be reasonable to sacrifice some VfM to secure bankability"; the frontier says there is no sacrifice to make: above the ceiling, transfer is not expensive but impossible, and the guarantee that "reduces" it is efficient retention under another name. The manual adopts the second reading and states it.
| Step in §3 | Rule | Source | Screen in §5 |
|---|---|---|---|
| 0 Framework | A taxonomy declared per project; GIH sector catalogue and correspondence to the eleven PFRAM categories; the same matrix from approval to tender documents | Reference Guide v3, §3.3.2 ("matrices must be reviewed again before signing"); PFRAM 2.0, §III.E, table 1; GIH 2019 (each matrix's header); APMG ch. 5, §5.3 | Project configuration (C2); allocation matrix with sector loading (C3) |
| 1 Identify | Register with phase, trigger and "not applicable" with reason; questions per category | Reference Guide v3, §3.3.1 (register; box 3.7); PFRAM 2.0, §III.E (questions per category; "risks not identified or not clearly allocated"); APMG ch. 5, §5.3 and box 5.18; EPEC 2011, §1.2.2; Chile: Acceso Norte a Concepción, art. 1.13.3.1 ("not applicable") | PFRAM fiscal risk (C7); register (C9); allocation matrix (C3) |
| 2 Allocate | Irwin's three questions plus the bankability ceiling; shared only with a sharing rule; per‑row justification; risks and rights together | Irwin 2007, ch. 4 (pp. 56–65); Reference Guide v3, §3.3.2 (criteria and limits); APMG ch. 5, §5.1 and §5.6 (default position; four capacities); OECD 2012, principle 6; Austral, Retention Frontier, §§2–4; Chile: Acceso Norte a Concepción, arts. 1.13.3.2–1.13.3.3 (bands); Puente Industrial, arts. 1.12.8–1.12.9 and 1.8.17.2 (deductible and net present income); Peru, guideline 1.4 (bands) | Allocation matrix (C3); cross‑sector comparison (C4); allocation summary (C5) |
| 3 Rate | Two named scales (3 × 3 PFRAM; APMG‑type 5 × 5 with Austral's bands), before and after; the order is what is compared | PFRAM 2.0, §III.E, figures 7 (rating) and probability/impact scales; APMG ch. 5, §5.4.2 and box 5.19 (Orange Book; "no absolute standard"); Reference Guide v3, §3.3.1 (heat map) | Mitigation planning (C6); fiscal risk (C7); register (C9); 5 × 5 matrix (C10) |
| 4 Mitigate | Action, owner, verifier, status; priority as rating × mitigation; early mitigation as the baseline | PFRAM 2.0, §III.E, figure 8 (priority) and the three action paths; APMG ch. 5, §5.5 (geotechnical and archaeological baseline) and §5.2 (strategies for retained risk); Reference Guide v3, §3.3.1 ("mitigating risks"); Chile: Puente Industrial, art. 1.12.9 (30 m baseline) | Mitigation planning (C6); register (C9) |
| 5 Value the premium | Probability × impact × the phase's cost base, published scale, cap, split into retained / transferred; specific / systematic | APMG ch. 4, §4.4 (formula and example; systemic in the rate); Reference Guide v3, §3.3.1 (Infrastructure Australia vol. 4; South Africa module 4); M1 Step 5 and D28; Austral, Recognition Rule | VfM risk allocation (C15) |
| 6 Value the tail | Distribution per risk, N and seed; VaR and CVaR at 90 / 95 / 99%; declared independent sum; the correlated case referred to M9 | APMG ch. 4, §4.4 (Monte Carlo, "tens of thousands of iterations," only with reliable information); Artzner et al. 1999 (coherent CVaR); Austral, Retention Frontier, §5 (correlation of the retained book); Stress‑Testing PPP Portfolios | VaR / CVaR layer (C12) |
| 7 Test | Per‑risk verdict against the frontier; M − P per transfer; implicit cost of capital; bankability; read as an order | Austral, Retention Frontier, §§2–6 and 9, appendices B–C; APMG ch. 5, §5.1 (figure 5.8, the optimum) and §5.6 (exception decision rule); Reference Guide v3, §3.3.2 (limits; OECD 2008); Arrow and Lind 1970; DIPRES 2024 (control case) | No screen: reproducible call from annex 4.A; VfM allocation diagnostic |
| 8 Clauses | Every row tied to an article; clause families; list of silences; general closing rule; rows with a payment clause sent to M2 | Reference Guide v3, §3.3.3 ("how payments flow"; exception to the functional principle); APMG ch. 5, §5.7 (compensation, relief, force majeure) and §5.9 ("all‑risk" clause); World Bank 2019, Guidance on PPP Contractual Provisions, chs. 1–3, 6, 8–9; Infrastructure Australia vol. 3, chs. 16–17, 20–21 and vol. 7, ch. 19; PF2 2012, chs. 15–17; Chile: Acceso Norte a Concepción, arts. 1.13.3, 1.8.2.3, 1.11.3, 1.17, 1.18.1.1, 1.18.1.4; Maipú–La Florida Hospital, arts. 2.5.13, 1.8.11, 1.11.1, 1.12.13; Technical Panel D04‑2019‑15 and D15‑2020‑17; Concessions Law, art. 19; Regulations, art. 36; Austral, Silent FX Liability, Indexation Ceiling, Renegotiation Triangle | Contract risk matrix in FARO (C16); guarantees tab (M2) |
| 9 Verify, register, monitor | Consistency checks; dashboard by status and severity; matrix version; handoffs to cost of capital, to the tender and to VfM | APMG ch. 5, §5.2 (monitoring of retained and transferred risk; "ultimate responsibility to the taxpayer"); EPEC 2011, §1.2.2 (monitoring and review); PFRAM 2.0, §III.E (matrix "periodically assessed by the contracting authority"); OECD 2012, principles 7 and 8; Austral, Retention Frontier, §6 (implicit rate) | Checks (C11); fiscal summary (C8); monitoring (C13); reports and exports (C14); cover and "Send to" (C1) |
| 3.10 Frontier: the portfolio | One page: what happens when the matrices are added up | Austral, Stress‑Testing PPP Portfolios; Retention Frontier, §5; PFRAM 2.0 (per‑project matrix, portfolio in M2); M9 | — (one line in 5.9) |
This section is the complete method, written so that someone with their own spreadsheet, their own model and their own fiscal register can build, allocate, rate, mitigate and value a contract's risk matrix without the platform: each step says what goes in, what comes out, how it is decided and what the decision rule is. Each rule's credit is in §2 and is not repeated; the Chilean counterpoints that illustrate it are in §2.5 and are cross‑referenced; the figures that illustrate the steps are §4's and are explained there. The rules the platform runs are quoted as they stand and with their owner: PFRAM's tables are PFRAM's; the five‑level grid's bands, the frontier's band and the cost‑of‑capital handoff are Austral conventions and are published as such. What the method requires and the platform does not do is declared as a limit where it applies, and detailed in §5. The method has ten steps and one page on the frontier: from the framework (Step 0) to verification, registration and monitoring (Step 9), the reviewer's summary (3.9) and, after that, what happens when the matrices of many contracts are added up (3.10), which the manual bounds and does not teach.
Three warnings before starting. The first is the manual's thesis: a risk allocation is a row in the register, a clause and a figure, and the method does not accept any of the three without the other two — a row with no clause is a risk retained by silence; a clause with no row is an obligation no one rated; a figure with no row and no clause is another contract's premium. The second: the method applies to a project that has already passed the eligibility gate (M3, transferability criterion) and before the payment mechanism (M4), the comparator (M1) and the fiscal register (M2) exist; all three receive what this method produces, which is why most of their errors are born here. The third: the method runs through the four verbs — identify, allocate, mitigate, value — in that order, and returns to the second when the fourth contradicts it: Step 7 exists to hand back to Step 2 the rows the retention frontier does not support.
In. The project profile: sector, asset type, cycle stage (appraisal, structuring, tender, contract), investment, term and construction period, expected payment mechanism (user‑pays, availability, mixed), expected government support (none, subsidy, guarantee), market and legal‑system maturity; the service specification by output (M3, criterion 2), because a performance risk can only be written against an output the contract requires; and the taxonomy that will govern the register.
Out. Three things, on one page heading the matrix: (i) the profile, written with the fields above; (ii) the starting catalogue, the sector's sub‑risks with the typical allocation the practice recommends for that sector — the manual uses the Global Infrastructure Hub's sector allocation tool, eighteen sectors and seventeen categories (§2.4), which the platform loads as is; and (iii) the correspondence table between the catalogue's categories and PFRAM's eleven fiscal categories the finance ministry will read, which is this manual's header table. For §4's hospital: "hospital" sector in the catalogue, sixteen categories and 47 sub‑risks, six of which fall into a single fiscal category (construction) and one ("strategic / counterparty") into adverse government action (§4.1).
How it is decided. There is no calculation, there are two declarations and a consequence. The first declaration is the taxonomy: one per project, stated out loud at the start, with the rule that risks can be added during the cycle but not renamed midway — the matrix at approval and the matrix in the tender documents have to be the same matrix, row by row, and the comptroller general checks exactly that (§1.3). The second is the correspondence: each catalogue category points to a fiscal category, and the analyst does not invent it, takes it from the header table (or corrects it, and then publishes the correction). The consequence is that the expected payment mechanism already decides a row's destination before it exists: under availability payment, demand is retained by design; under user‑pays, it is transferred or shared with a guarantee; Step 2 confirms this and Step 7 tests it, but the profile says it first. The correspondence table is a mandatory part of the framework, not a recommendation for when the finance ministry demands a fiscal reading: without it, Step 3 has no second scale, Step 8 has no "goes to the fiscal register" column, and "land risk" and "expropriations" can end up as two rows in two documents (§6.1).
Decision rule. One declared taxonomy per project; one starting catalogue by sector, named with its source; one correspondence to the eleven fiscal categories, published — without it, there is no Step 0. And the rule the guides state and teams forget: the matrix is a versioned document from this step on — the approval's, the tender documents' and the signed contract's are versions of the same matrix, not three matrices (Step 9).
Where teams go wrong. This step's errors — adopting the tool's vocabulary as the taxonomy, allocating by category instead of by sub‑risk, omitting the cycle stage and with it the ability to version — are in §6.1 with the hospital's figures; a cross‑reference is enough here.
In. Step 0's starting catalogue; the studies available at this stage (demand, engineering, land, environmental, legal); the three questions per risk — can it happen in this project?, in which phase?, what would trigger it? — and PFRAM's identification questions by fiscal category (34 questions across eleven categories, with conditional follow‑up: the platform loads them as a bank, §5.2), which help avoid forgetting what the sector catalogue does not name (governance, financial rebalancing, renegotiation).
Out. The register: one row per risk, with name, catalogue category and fiscal category, phase (pre‑construction, construction, operation, termination, or "all"), trigger (what makes it happen, in a sentence with a subject), and two blank cells Steps 3 and 4 fill in (rating before and after; mitigation with an owner). And, separately, the "not applicable" list with a reason: the catalogue risks left out of the valued register, and why. For §4's hospital: sixteen catalogue categories → ten valued rows and six "not applicable" with a reason (social, environmental, financial markets, force majeure, adverse government action, early termination), each with the fiscal reading that captures it even though it has no row (§4.2).
How it is decided. Row by row, with the three questions. The first — can it happen? — is answered with the study or the precedent, never with intuition: a risk that "does not apply" has to have a written reason (the site is public land and there is no resettlement; there is no foreign‑currency debt; catastrophe insurance covers reconstruction). The second — in which phase? — is not a detail: the cost base against which the premium is valued is its phase's (Step 5; M1 Step 5), and a risk with no phase cannot be valued. The third — what would trigger it? — is the one Step 8 turns into a clause: "a site condition different from the one studied" calls for a geotechnical baseline; "a new health regulation requiring works" calls for a change‑in‑law clause with a threshold. PFRAM's questions are worked through afterwards, by category, to surface what the sector catalogue leaves in shadow: the hospital's row 10 — renegotiation — is not a catalogue risk, it is the consequence of any of the other nine being badly written, and the register carries it so that every step shows it is the most expensive row in the retained book (§4.2, §4.6). "Not applicable" risks are carried as a separate list from the valued register, with the reason and the fiscal category that captures them, and not as register rows with their own status: the platform has no such status, and the fiscal reading by category captures them anyway; a "not applicable" row with its own status would only make sense in an exportable tender‑document annex that does not exist today.
Decision rule. Risks that "do not apply" are also recorded, with the reason, in a separate list: the 2023 tender documents' "minimum revenue guarantee: does not apply to this project" is a written decision, not an omission (§2.5), and it is exactly the difference between retaining a risk by design and retaining it by silence (Step 8). A register with no phase cannot be valued; a register with no trigger cannot be written as a clause.
Where teams go wrong. Recording by category ("construction risk") instead of by risk with a trigger, and discovering in Step 8 that the row points to no article because it does not say what happens. Confusing the register with the allocation matrix: the register says what can go wrong; the matrix says who bears it; the two share the row and neither replaces the other. And the costliest error: leaving out of the register what the sector catalogue does not name because "it is not a project risk" — renegotiation, financial rebalancing, the implicit guarantee: these are the rows Step 8's list of silences will have to capture anyway, and they come cheaper if they enter here.
In. Each register row and Irwin's three questions (2007, ch. 4; Reference Guide v3, §3.3.2): who can reduce the probability of it happening?, who can reduce the impact if it happens?, who absorbs it more cheaply — diversifies, insures, has fiscal space? Plus Austral's fourth question (§2.6): how far will the private partner accept it at any price? — the bankability ceiling τ_max, the maximum fraction the project debt market will take before closing. And the sector catalogue's typical allocation as a default position to confirm or refute, not as an answer.
Out. Per row: the allocation — retained, transferred, shared — with its degree (the fraction the State retains: the platform stores a split per row, Public / Private / Shared, with a percentage bar summing to 100, and the comparator five degrees, 100 / 80 / 50 / 20 / 0% retained: the rule linking them is the majority‑share rule, with a tie going to shared); the sharing rule if shared — percentage, deductible, bands, cap; and the written justification, in one line answering the three questions. For the hospital: three retained rows (regulatory change at 80%, clinical demand and renegotiation at 100%), six transferred (four at 100%, two at 80%) and one shared by halves (land, permits and soil), with each one's justification in §4.3's table.
How it is decided. With the one‑page tree, worked through in the order of the questions and stopped at the first answer that decides:
| Question | Answer and consequence |
|---|---|
| Who reduces the probability? | The partner (works contract, replacement plan, closed design) → candidate for transferred; the State (sets the standard, refers patients, hands over the site) → candidate for retained; neither (the site condition is what it is; an earthquake) → go to the second question |
| Who reduces the impact? | One party, alone → that party, to the extent it reduces it; both, each a part (permits the State; engineering the partner) → shared, and a sharing rule has to be written |
| Who absorbs it more cheaply? | The partner diversifies or insures at a cost that fits in the bid → confirms the transfer; the sovereign (macro risk, catastrophic tail: Arrow and Lind; ruin asymmetry, §2.6) → retained or shared by bands, even if the partner could manage part of it |
| How far does the partner accept it at any price? | The whole proposed fraction (τ ≤ τ_max) → the allocation holds; less than the proposed fraction (τ > τ_max) → the part above the ceiling comes back to the State as a guarantee, named or not: it is written down (Step 8) or reallocated |
"Shared" is the outcome of the second question when each party controls one half, and it requires a rule: the word alone allocates nothing (§6.2). The four forms the rule takes, in the order contracts write them: a fixed percentage (50/50, or the screen's bar); a deductible, what the partner bears alone before the State steps in; bands, a deductible plus a shared band at a percentage plus an excess to the State (or deducted from the present value of revenue); and a cap on the partner. Chilean counterpoint, cross‑referenced to §2.5: the additional environmental measures row in the 2023 tender documents is a deductible, a 50% shared band and an excess to the MOP (UF 236,000 / 100,000 / the rest), and the same row in 2013 was a UF 30,000 deductible with the excess deducted from the present value of revenue — the evolution from "entirely at risk" to "banded distribution" the manual states as Austral's own position. The rule is hard, not a reviewer's warning: a "shared" row with no sharing rule goes back to this step until it has one, and does not move on to Step 3, because in Step 8 it would be a row with no article and in Step 9 it would be the matrix version the Technical Panel receives.
The fourth question is answered at this step, qualitatively — is there a debt market that will take this risk at this fraction?, or will lenders hand it back through a guarantee? — with the answer written in the justification, and in figures at Step 7, where the ceiling has a value per risk class and the verdict compares against it: an allocation reaching Step 7 with a transfer above the ceiling already arrives with the answer written — "the partner will not take on the occupancy of a public hospital without a guarantee" — and the verdict only confirms it.
Decision rule. Three rules, and the manual accepts no row without all three. First: "shared" with no sharing rule is not an allocation, and the row does not move forward. Second: transferring a risk the private party does not control is worth M − P and no more — the management gain minus the premium the partner charges for bearing what it does not manage (§2.6) — for project risks (works, operation, life cycle) M − P is positive and the transfer creates value; for macro risks (demand the State controls, exchange rate, inflation, change in law) it is negative and the transfer destroys value, even though a naive comparator credits it (§4.7: transferring the hospital's clinical demand is worth −0.160 at 20% retained, −0.750 at 0%). Third: a risk transferred beyond its bankability ceiling comes back to the State as a guarantee, named or not (Austral, Retention Frontier, §4; Silent FX Liability): the minimum‑revenue guarantee is demand brought back under the ceiling, the debt guarantee is financial risk brought back, and the one no one wrote down is the implicit guarantee in the list of silences (Step 8).
Where teams go wrong. Allocating by sector analogy ("hospitals retain demand") with no written reason: the reason is what the catalogue's cross‑sector comparison shows — demand is public in the hospital's two rows and shared or private on highways because who controls the volume changes by sector — and what the committee asks when someone proposes transferring it "because it creates value" (§4.3). Treating the catalogue's typical allocation as the allocation: it is a default position confirmed by the three questions, and §4's hospital refutes it on the land row (the catalogue puts it with the State; the method shares it by halves because the partner controls the soil engineering). And the most frequent one: transferring the tail — "all cost‑overrun risk is the partner's, uncapped" — and discovering in the bid that the partner priced it back in as a premium (M1), or at financial close that it came back as a guarantee (M2), or in year five that it came back as a renegotiation (M4): the 59% the MOP retains at the P95 in box 4.9c is the part of the tail no "entirely at risk" clause ever really transferred.
In. Step 2's allocation and the evidence: study bands (P10–P90 demand, construction budget contingency), sector precedents (documented cost overruns and delays; Green Book optimism bias), and dispute decisions where they exist (for change in technical standard, the Technical Panel's rulings from §2.5). And the two published scales, with their names.
Out. Per row, probability and impact on two scales, before and after Step 4's mitigation — the "after" cell is filled once Step 4 is done and shown here — and the heat map with each row placed. The two scales, exactly as the platform's engine returns them:
The fiscal scale, PFRAM 3 × 3, by category (eleven categories; the finance ministry's reading; PFRAM 2.0, §III.E, figure 7):
| Probability \ Impact | Low | Medium | High |
|---|---|---|---|
| Low | low relevance | low | medium |
| Medium | low | medium | high |
| High | medium | high | critical |
The operational scale, 5 × 5, by register row (probability and impact on five levels: very low, low, medium, high, very high; score = probability × impact, 1 to 25; bands 1–4 low, 5–9 medium, 10–16 high, 20–25 critical). The grid is the Orange Book's, which APMG recommends (ch. 5, box 5.19) with no scores or bands fixed — "there is no absolute standard"; the bands are an Austral convention and the manual publishes them as such.
For the hospital: on the 3 × 3, construction high × high = critical, operation and renegotiation medium × high = high, financial medium, and seven categories low or low‑relevance (a 7 / 1 / 2 / 1 mix); on the 5 × 5, the works cost overrun high × high = 16, high, six rows at 12 before mitigation and only one — clinical demand — still at 12 afterwards, because no mitigation reduces a hospital's occupancy: it is the row that is not mitigated but paid for (§4.4).
How it is decided. With evidence, not room consensus: the probability of a risk with a study is the study's band read against the scale; that of a risk with no study is the sector precedent; that of a risk with neither is "medium," declared as such and flagged for the next version. Impact is read on the party bearing it after allocation — on the fiscal scale, on the State; on the operational scale, on the project — which is why the two readings can differ without contradicting each other: the hospital's demand is low relevance on the fiscal reading, because under availability payment the State's payment does not change with occupancy, and high on the register, because for the ministry's budget occupancy exists (§4.4). The "before" rating is the inherent risk, with the allocation already made and no Step 4 mitigation; the "after" is the residual. The method requires both scales always, for any project going through a fiscal approval — which is this manual's case — not just the 3 × 3 when the finance ministry asks for it: Step 5's retained/transferred split and Step 9's cost‑of‑capital handoff are done by fiscal category, and without the 3 × 3 there is no fiscal category on the row.
Decision rule. Both scales, always, coexist under their own names and are not silently harmonised: high × high is "high" (16) on the 5 × 5 and "critical" on the 3 × 3, and both are correct on their own grid; what is compared across scales is the order of the rows — the works cost overrun is first on both — not the label. The 3 × 3 rating is published as PFRAM's figure 7; the 5 × 5's bands as an Austral convention; and every rating carries its scale in the same cell ("high, 5×5" / "critical, PFRAM").
Where teams go wrong. The scale living in the analyst's head (§6.3): "high" worth 0.5 on one sheet and 0.75 on another, and a register with bands but no probability that rated all ten risks the same. Writing "critical" on the fiscal reading and "high" on the register with no note on which grid each is from, and presenting the report as if it contradicted itself. And skipping the "before": a register with only the residual rating cannot show what the mitigation did, and Step 4 has nothing to measure against.
In. The register rows with their "before" rating and PFRAM's priority rule (2.0, §III.E, figure 8: rating × existing mitigation), exactly as the screen applies it: unmitigated critical → act urgently; mitigated critical and unmitigated high → plan mitigation; mitigated high, medium and unmitigated low → monitor; mitigated low and low‑relevance → accept. One cell differs from PFRAM, and the manual publishes the screen's table with the cell flagged, rather than publishing figure 8 as the rule and the screen as a simplification: unmitigated medium is "high priority" in figure 8 and "monitor" on the screen. In the hospital it does not bite — no category falls into unmitigated medium — and the reader who finds it in their own project knows what the difference is.
Out. For each row with plan‑or‑act priority — and for the rest if the team wants: the action, contractual (clause, guarantee, bond, insurance, deductible, bands) or managerial (study, permit, site handed over before signature, baseline); the owner (an entity or a post, not a party); the verifier (who checks the action was done, and when: site inspector, health service, Technical Panel, finance ministry, comptroller general); the date and the status (open / in mitigation / in monitoring / closed); and the residual rating, which flows back into Step 3 as "after." For the hospital: ten rows with action, owner, verifier and status in §4.5's table — five open and five in monitoring — with construction (critical, mitigated: plan) and renegotiation (high, unmitigated: plan) as the two the priority rule flags for effort.
How it is decided. Priority first, which says where not to spend: rows at "accept" and "monitor" get no plan, they get a review date. Then, for each row with a plan, the question that separates mitigation from transfer: does the action reduce the probability or the impact of the event, or move the risk to another row? A site handed over and studied before signature reduces the probability of an unforeseen condition; a geotechnical baseline does not reduce it, it defines who pays when it occurs — it is allocation written as mitigation, and goes to Step 8. Catastrophe insurance does not lower the earthquake's probability: it turns force majeure into coverage risk and premium risk (does it cover the design earthquake?, who is the beneficiary?, what happens if the premium rises?), and the register carries the new row (§4.5). Finally, owner and verifier: the owner is whoever carries out the action; the verifier is whoever can say it was not done, and has to be someone other than the owner.
Decision rule. A mitigation with no owner and no verifier does not lower the rating: the residual is accepted only with both names and the date; until then the row keeps its "before" rating (§6.6). And a mitigation that "transfers" a risk does not eliminate it, it moves it to another row, which is recorded with its own trigger. The first rule is hard and requires both names: the residual is not written without an owner and a verifier, and the 3.9 reviewer invalidates it if it is; a "recommended" owner and verifier are not enough. The reason lies in the tool: the platform has an owner field — and stores it as a party, Public or Private, not as an entity — and has no verifier field, so the "mitigation with no owner" check passes without there being a real owner; the method's rule is the only thing stopping that field from being filled with a made‑up name.
Where teams go wrong. The "mitigation" column with a verb and no name, date or verifier, and a residual rating that drops on its own in the next version (§6.6). Counting insurance as force‑majeure mitigation without recording the row the insurance creates — the hospital carries that row as Step 8's first silence: the insurance covers reconstruction and no one wrote down what happens to availability while it is rebuilt. And planning against the "accept" rows because they are easy, while renegotiation — high, unmitigated, the most expensive row in the retained book — is left with no plan because its mitigation is writing the other nine well.
In. Rows with a retained fraction greater than zero (and, for the comparator, every row: the public sector comparator carries each at 100%); the Value for Money manual's published qualitative → numeric scale (its Step 5): probability very low 0.05 · low 0.20 · medium 0.50 · high 0.75 · very high 0.90; impact as a fraction of the phase's cost base — under 1%: 0.005 · 1–3%: 0.02 · 3–10%: 0.065 · 10–25%: 0.175 · over 25%: 0.35; the present value of the cost base by phase (construction, operation; user revenue for demand) at the comparator's rate; and the nature of each row, specific or systematic (the Value for Money manual's two‑rate convention).
Out. Per row, the expected premium = probability × impact × PV of its phase's base; the total premium with the 30% cap on the sum of the bases carrying risk (if the sum exceeds it, every row is scaled pro rata and this is declared); the retained / transferred split by Step 2's fraction — what the State still bears under the PPP and what the partner bears; and the specific / systematic classification, because under the two‑rate convention the systematic part is valued in the rate and not in the cash flow. For the hospital, at two rates: gross premium 117.05 against a ceiling of 126.15 (7.2% margin: the cap does not bite), of which the State retains under the PPP 12.59 (10.8%) and transfers 104.46 (89.2%), plus renegotiation — which exists only in the PPP branch and is retained in full — 13.67; the State's retained book is 26.25. At a single rate of 5.5%, 97.37 / 104.75, 10.57 / 86.79, 11.35 and 21.92: the proportions do not change with the rate, the level does, and the convention is published with the figure (§4.6.1). Clinical demand is in the register, retained at 100% and with no premium: a zero base under availability and systematic, valued in the rate; it exists for the ministry's budget and is declared as such (§4.6.1). A retained systematic row stays in the valued register, with a zero premium and the note "valued in the rate"; it is not pulled out of the register to appear only in the fiscal reading, even though that is what the demonstration pack effectively does by giving it a zero base: the row still has to reach Step 8 with its clause — the variable per‑bed‑day subsidy is the clause for a row with no premium in the comparator — and it is the row this manual hands to Fiscal Commitments.
How it is decided. The scale is the same as the comparator's and is not recalibrated per project: it is published precisely so that two analysts give the same premium to the same risk (§6.3). The base is the row's phase base (Step 1): an operation risk valued against the construction base is a phase error, not a scale error. The retained fraction is Step 2's, under the five‑degree rule; and the split is arithmetic: retained premium = premium × retained fraction, transferred premium = the rest. Nature is decided by M1's question: does the risk move with the cycle (demand, inflation, exchange rate, rate) or is it project‑specific (works, operation, life cycle, permits)? — systematic risks, under two rates, sit in the PPP's spread and not in the cash flow. The 30% cap is a series convention, not the guides', and is published as such.
Decision rule. The same scale and the same rate as the comparator: this step produces M1 Step 5's input and is not recalculated there — the comparator's register and this manual's are the same matrix in two vocabularies (§4.3). A retained risk with no clause is valued the same as one with a clause: the absence of a clause does not make it free (Austral, Recognition Rule); what changes is the destination — with a payment clause, it goes to M2 as a valuable contingent liability; with none, it goes to the fiscal‑risk matrix with probability and impact and no money (Step 8). And the mean is the comparator's figure; the tail belongs to Step 6.
Where teams go wrong. Crediting the transfer at full premium — §6.4's error, which Step 7 exists to catch — and recalculating, in the comparator, with a different scale or rate, the premium this step already produced (§6.3). And an error specific to this step: forgetting renegotiation, the one row public works does not have, which is retained in full under the PPP and which in the hospital is worth more than the nine retained rows put together (13.67 versus 12.59).
In. Step 5's retained rows with a distribution declared per risk — triangular (minimum, mode, maximum), normal (mean, standard deviation) or lognormal — and its probability of occurrence; the number of draws N and the seed. When there is no risk‑specific distribution, the manual's default rule: a triangular with minimum, mode and maximum at the lower bound, the point value and the upper bound of Step 5's impact band on the scale (3 to 10% with 6.5% as the point value; 10 to 25% with 17.5%), as a fraction of the PV of the phase base, multiplied by the retained fraction; probability of occurrence, Step 5's p. Under this rule each triangular's mean is its point value, and the simulation's mean has to reconcile with Step 5's retained premium — this is the check that the bands are the same ones.
Out. The distribution of total retained loss; the mean, median, standard deviation and maximum; the VaR and CVaR (expected shortfall in the tail) at 90, 95 and 99%; the histogram; and each row's contribution to the mean. For the hospital, five retained rows, N 10,000, seed 42: mean 26.49 (reconciles with 26.25), median 26.33, VaR95 53.48, CVaR95 59.40, VaR99 62.99; renegotiation contributes 52% of the mean. With N 5,000 — the screen's default — 26.38 and 52.79; with a different seed, 26.34 and 53.69: the order and the multiple (one bad year in twenty costs double the mean) do not move (§4.6.2).
How it is decided. Three decisions and one check. The distribution: triangular when what is available is a band (the normal case); normal when there is a symmetric historical series; lognormal for long tails (large works cost overruns, litigation). Probability of occurrence is Step 5's p, not a new one. N and the seed: N no less than 10,000 so the P95 is stable to the second decimal on two‑digit figures, and a published seed with the figure, because a tail with no seed cannot be reproduced (M1, §6.5; §6.5 of this manual). The check: the simulation's mean against Step 5's retained premium; if they do not reconcile, the bands are not the scale's and it has to be said why. Both — N no less than 10,000 with a published seed, and the default band rule when there is no risk‑specific distribution — are publication rules of this method, not an inherited convention that is merely cited or an example: they are what makes two analysts' tail over the same matrix the same tail. The screen opens at N 5,000 with a fixed seed of 42, and §5 declares this.
Decision rule. N ≥ 10,000, seed published with the figure, and the scale's default bands when there is no risk‑specific distribution. Risks are summed independently — the layer does not correlate — and the manual says so every time it publishes a VaR: for risks a macro shock triggers all at once (demand, exchange rate, inflation, rate) the independent sum understates the tail, and that case goes to portfolio stress testing and to the frontier's correlated variant (Austral, Stress‑Testing PPP Portfolios; §2.6; M9). For the hospital, with a zero demand base and no dollar debt, this does not bite and is declared; for a highway with a revenue guarantee and indexation, it would bite. The tail is the figure the finance ministry compares with its reserve; the mean is what enters the comparator. And the rule from box 4.9c, which this step adds to the allocation: a banded rule with no declared distribution is an allocation with no figure — the deductible and shared band in the 2023 tender documents only say how much the MOP retains once the cost overrun is drawn: in expectation, 36%; at the P95, UF 405,000, 59%; with the concessionaire capped at UF 286,000 for everything above the median (§4.9c).
Where teams go wrong. The tail no one summed (§6.5): each risk with its "maximum" in a column, and the book's maximum as the sum of maximums — which never happens — or as nothing. Running the tail on a demo pack's abstract units and comparing it with a reserve in pesos: a tail with no monetary base is not a figure (§4.6.2). And the subtlest one: two probability scales on the same platform — the demo pack's layer reads "high" as 0.7 and the comparator as 0.75 — which, on the hospital's regulatory change, moves the retained premium from 2.85 to 4.28 (§6.3): p is Step 5's, and it is typed in by hand.
In. Step 2's matrix with the observed retained fraction per row (α_obs) and each one's frontier class, from the paper's eight‑class taxonomy (Austral, Retention Frontier, appendix C): construction; operation and maintenance; demand; exchange rate; inflation / indexation; interest rate; force majeure; political / change in law. And the calibration per class — transfer premium p, management value m, sovereign retention cost r, bankability ceiling τ_max — which is illustrative and declared as such.
Out. Four readings of the same matrix. (i) The per‑row verdict against the frontier: efficient retention α* = p / (p + 2m + r), bounded below by the bankability floor 1 − τ_max; a row is on the frontier if α_obs falls within a ±10 point band of α*, over‑retained above it, under‑retained below it, and in infeasible transfer if it transfers more than τ_max with a 2‑point margin; plus the matrix's total deadweight loss. The band and the margin are published with their figure because that is what the reader needs to reproduce the verdict with their own tool, and they are published as an Austral convention, not a guideline rule. (ii) The VfM of the allocation: M − P per transfer — which ones create value and which destroy it — and the matrix's implicit cost of capital, r_f + Σ τ_i p_i. (iii) The VfM of the project run through the matrix (M1, Steps 7–9): the same profile with demand retained and with demand transferred, described with the matrix and with no new figures. (iv) The bankability reading: rows transferred beyond τ_max are the ones lenders will hand back with a guarantee, and go to Step 8 with a name.
For the hospital (§4.7): the four works rows and the three operation rows on the frontier or within two points of the band (under‑retained by two points: transferred in full where the frontier would transfer almost everything); design and land over‑retained because the "construction" class does not distinguish scope change or site, and Step 2 already wrote why they stay with the State; regulatory change at the ceiling: α* of 85% forced by bankability (τ_max 0.15) against 80% retained, "infeasible transfer" by three points, which is the general change in law with a threshold the guides leave to the partner — the label says that if that 20% included the specific change, lenders would hand it back with a guarantee; and clinical demand at 100% retained, M − P = 0, "over‑retained" against an α* of 57% that is the traffic calibration applied to a hospital where the State refers patients (with m → 0, efficient retention rises toward 85%). The contrast: transferring demand is worth −0.160 at 20% retained, −0.427 at 10%, −0.750 and infeasible at 0%; and since the hospital's VfM rests entirely on the transfer of works and life‑cycle risk, the sign flips with demand transferred before anyone has written the payment formula (§4.7; M4 showed this from the mechanism, this manual from the matrix).
How it is decided. It is read in order, not in decimals. First the infeasible ones: each goes back to Step 2 (retain more) or to Step 8 with the guarantee written down and to M2 to value it; none goes to the tender documents as is. Then the under‑retained macro‑class rows (demand, exchange rate, inflation, political): these are transfers that destroy value, and the question is whether the State wants to pay the premium for management it does not get; the usual answer is to share by band (M4's minimum revenue guarantee with co‑participation is demand shared at the frontier: at 50% retained, the hospital would show +0.312, on the frontier). Then the over‑retained project‑class rows (construction, operation): these are value left on the table, unless Step 2 wrote why (a scope change the State requires; a site the catalogue places with the State). Rows on the frontier are left alone. And the implicit rate is compared with the cost of capital the corresponding module estimates on its own (Step 9): if the matrix implies a higher premium than the market charges, the matrix is over‑transferring.
Decision rule. A matrix with infeasible transfers does not go to the tender documents: the verdict blocks, and the only way out other than reallocating at Step 2 is the guarantee written at Step 8 and sent to the fiscal register to be valued — not a warning the tender documents can carry as is. The verdict is read as an order — which row is furthest from the frontier — not as a figure, because the calibration is illustrative: the premium per risk is not observable; a bid gives a total IRR, not a decomposition (§2.6). And the rule this step imposes on the Value for Money manual's Step 7: charge the State r, the private party p, and credit the transfer only with the net M − P — a comparator that credits demand transfer at full premium books value created where the frontier shows value destroyed.
Where teams go wrong. The risk that was transferred and came back (§6.4): the spreadsheet credits demand transfer at full premium, the frontier shows a negative M − P, and the minimum revenue guarantee brings it back at financial close under another name — the Coastal Highway's §4.9b carries that row as a guarantee valued at an expected 68.0. Reading the verdict as a measurement ("demand is over‑retained by 43 points") instead of as an order. And testing only VfM (M1) without testing the allocation: the hospital has positive VfM with the example's matrix and would also have it, in a naive comparator, with demand transferred; only the frontier tells the two apart.
In. Step 7's tested matrix, with every row allocated, rated, mitigated and valued; and the clause families where the allocation is written, with their reference wording (World Bank 2019, Guidance on PPP Contractual Provisions, chs. 1–3, 6, 8–9; Infrastructure Australia vol. 3, chs. 16–17 and 20–21, vol. 7, ch. 19; PF2, chs. 15–17; §2.4).
Out. Two lists. The clause checklist, one entry per row with an allocation other than "fully transferred" — and one per transferred row if the contract writes it — in the families the manual uses:
| Family | What the clause has to say |
|---|---|
| Land and site handover | Handover schedule by percentage; consequence of delay (time, money); site condition: baseline |
| Permits and environmental ruling | Who pays additional measures, at what deductible and bands; how they are valued; who resolves disputes |
| Utility relocation | Deductible; reimbursement; deduction from the present value of revenue |
| Design and change in technical standard | Which version of the standard governs; who pays for a change; the boundary between a raised standard (compensable) and design risk (not compensable) |
| Force majeure | Definition; time; money; termination; mandatory insurance and beneficiary |
| Adverse government action and change in law | General with threshold (or by bands, as in Australia vol. 3 §20.2.3) / specific compensated; a change prior to the bid is the partner's own cost |
| Demand | The payment mechanism (M4); minimum revenue guarantee and co‑participation; time extension; per‑unit subsidy and over‑demand compensation |
| Termination | Grounds; termination payment formula; what happens to the debt; financial‑risk distribution option |
| Insurance | Which, how much, who is the beneficiary, what happens if the premium rises |
| General closing rule | "No compensation for events affecting profitability": turns silence into private retention |
The Chilean article where each family usually lives — site handover by percentage and the geotechnical baseline, the three environmental and utility‑relocation bands, the Technical Panel's two rulings on technical standard, suspension for force majeure and catastrophe insurance, the minimum revenue guarantee and the per‑bed‑day subsidy, extinction with its formula and the financial‑risk distribution option, and "entirely at risk" — is in §2.5, with the tender‑document generation it belongs to, and in the hospital's clause list (§4.8.1).
And the list of silences: the rows left with the State with no article saying so, with probability and impact and no money. For the hospital (§4.8.1): eleven clauses with their reference article in Chilean hospital tender documents, and five silences — force majeure above the insurance, the change in technical standard that is not a change in law, clinical demand below the table, the implicit guarantee, inflation above 2%.
How it is decided. Row by row, with two questions. What article writes this allocation? If one exists, it is cited and checked against what it says versus what the row says (degree, sharing rule, trigger): a "shared by bands" row whose clause says "50%" is not written. If none exists, the row is a risk retained by silence — unless the general closing rule hands it back to the partner, in which case it is retained by the partner with no figure and goes to Step 7's bankability reading — and it enters the list of silences. Does the clause carry payment? If the article obliges the State to pay when the risk occurs (guarantee, compensation, variable subsidy, termination payment), the row is a valuable contingent liability and goes to M2's Step 3 with its clause; if not, it stays in the fiscal‑risk matrix with probability and impact and no money. For the hospital's clinical demand, the answer is yes — the per‑bed‑day subsidy and over‑demand compensation — and it is the row M5 hands to M2; for the Coastal Highway (§4.9b), five rows with a clause go to be valued and five with no clause stay. The list of silences is also handed over to the fiscal register, as rows in the contract's risk matrix with probability and impact, no money and a date; it does not stay only in this manual's matrix while the fiscal register receives only the rows with a clause. The reason is §4.10's and the Fiscal Commitments manual's rule that what is not valued gets recorded anyway: silences are the rows where renegotiations are born (Austral, Renegotiation Triangle), and the contract matrix in the fiscal register already has the cell for them (screenshot 16).
Decision rule. Every register row with an allocation other than "fully transferred" points to an article; a row with no article is a risk retained by silence and the manual lists it separately (§1.4); rows with a payment clause go to M2 as valuable contingent liabilities and silences go to the contract matrix. The general closing rule is not an allocation clause: it turns silence into private retention only up to the bankability ceiling; above it, the silence is the State's (the implicit guarantee is the fifth silence in any hospital). And the design/standard boundary the tender documents do not write and the Technical Panel resolves case by case is the clause missing from the design family, and the manual asks that it be written: the second generation of tender documents has it for three construction risks and not for this one (§2.5).
Where teams go wrong. Writing "shared" in the matrix and nothing in the contract, letting the first discrepancy decide the sharing rule (§6.2). Confusing the general closing rule with an allocation: "entirely at risk" does not transfer the tail (box 4.9c: under that rule the concessionaire's P95 is UF 691,000, which is the figure the lender hands back as a guarantee or as a renegotiation). And not taking the list of silences anywhere: a silence no one records is a liability rediscovered in the next crisis (§2.6, fiscal space).
In. The tender documents' matrix (version) and the register with its statuses; the fiscal reading by category; Step 8's clauses.
Out. Three things and four handoffs. (i) The consistency checks, cross‑checking what the steps produced: an incomplete fiscal reading (unrated categories); register rows with no catalogue category; high or critical fiscal risk allocated to the private party — backed by what guarantee?; a high risk with no residual rating; mitigation with no owner; and, beyond the tool, the ones the method requires and the screen does not run: register against fiscal reading (demand rated "high" on the register and "low relevance" on the fiscal side passes with no flag), owner as an entity and not as a party, the percentage matrix against the scenario's split (§5.10). For the hospital: three findings, all of them the "error" — critical construction to the private party, twice; high operation to the private party — that are correct and call for no change: they ask what guarantee backs the transfer, and the answer (fixed price, performance bonds, deduction regime) exists in the justification and not in a field (§4.8.2). (ii) The monitoring dashboard: rows by status, by residual severity and by category; high‑residual alerts; a per‑project table and a portfolio aggregate. For the hospital: five open and five in monitoring; residual four low, five medium and one high; one alert, clinical demand, the row that is not mitigated but paid for, which the dashboard keeps in view until the fiscal register picks it up (§4.8.3). (iii) The matrix's version: every figure in this manual carries the version of the scenario that produced it. And the handoffs: to M2 (that manual's Step 1), the rows with a clause and the list of silences; to the cost of capital, the fraction of each risk the partner retains — 0 / 50 / 100% per party — split by fiscal category into systematic (tilts the beta: 0.75 + 0.5 × systematic fraction) and specific (additive premium: 1.5% × specific fraction), with the legacy 4% × retained‑fraction premium kept only as a reference; to the tender, evaluation criteria weighted by the matrix; to the comparator, today an indication (retained/transferred fraction) and not the row‑by‑row register, which has to be reloaded by hand. For the hospital: systematic fraction retained by the partner 0% (the three systematic rows are public), minimum beta tilt 0.75, specific fraction 92.9% and idiosyncratic premium 1.39% — the partner bears specific risk and almost no systematic risk, which is what an availability contract should produce and what the low end of the PPP spread in the comparator assumes (§4.8.3).
How it is decided. Checks are run before the tender documents and at every version, and every finding is either resolved or declared with a reason — the hospital's three "errors" are declared: the guarantee exists, the field does not. The dashboard is read by residual, not by inherent risk: the row still high after mitigation is the one to pay for (clause) or watch (date); and each row's status is changed by the owner with the verifier, not by the analyst. The version is decided with a simple rule: any change in allocation, degree, sharing rule or clause is a new version of the matrix with a date, and the previous one is kept — the approval's, the tender documents', the signed contract's, each supplementary agreement's. Handoffs are made from the current version and carry its number.
Decision rule. Every figure carries the version of the matrix that produced it; a renegotiation that moves a risk is a new version of the matrix, not a correction, and the matrix the Technical Panel receives has to be the contract's, not the latest one (§6.7; M4, 3.13). And the Fiscal Commitments manual's rule applied to this step: what the tool does not hand off is loaded by hand at both destinations and declared (§5.8).
Where teams go wrong. No version — the renegotiated matrix overwriting the original — is §6.7 and is not repeated here. Two errors specific to this step: closing verification findings by changing the rating instead of writing down the guarantee; and monitoring by inherent impact, which does not move, instead of by residual, which is what the mitigation was supposed to move (the platform's dashboard measures residual severity by the "after" impact and not by the 5 × 5 score; the method reads it by score, §5.2).
The ten steps, with what goes in and what comes out:
| Step | In | Out | Rule in one line |
|---|---|---|---|
| 0 Framework | Profile; output specification; taxonomy | Sector catalogue; correspondence to the eleven fiscal categories; version 0 | One declared taxonomy per project; the same matrix from approval to tender documents |
| 1 Identify | Catalogue; studies; three questions per risk; fiscal questions by category | Register (name, categories, phase, trigger); "not applicable" list with reason | No phase, no valuation; no trigger, no clause |
| 2 Allocate | Irwin's three questions; Austral's fourth (ceiling); typical allocation | Allocation with degree; sharing rule; justification | Shared with no rule is not an allocation; transferring the uncontrollable is worth M − P; above the ceiling it comes back as a guarantee |
| 3 Rate | Evidence; two named scales | Probability × impact on 3×3 and 5×5, before and after; heat map | Scales are not silently harmonised; the order is compared |
| 4 Mitigate | Priority as rating × mitigation | Action, owner, verifier, date, status; residual | No owner or verifier, no lower rating; a mitigation that transfers moves the row |
| 5 Premium | Retained rows; published scale; PV of the base per phase | Premium per row; total with 30% cap; retained / transferred split; specific / systematic | Same scale and rate as the comparator; no clause, same valuation |
| 6 Tail | Distribution per row; p; N; seed | Mean, VaR and CVaR 90 / 95 / 99%; contributions | Independent, declared; the tail is the finance ministry's, the mean the comparator's |
| 7 Test | α_obs and frontier class per row; declared calibration | Per‑row verdict; M − P; implicit rate; bankability | No infeasible one goes to the tender documents; read as an order |
| 8 Clauses | Tested matrix; clause families | Clause list per row; list of silences; rows with payment to M2 | Every row points to an article; no article means silence |
| 9 Verify | Tender documents' matrix; register; clauses | Checks; dashboard; version; handoffs | Every figure carries its version; renegotiating is versioning |
Reviewer's checklist — what it requires and, if missing, what it invalidates: (1) declared taxonomy and published correspondence to the eleven fiscal categories; (2) register with phase and trigger per row, and "not applicable" list with reason; (3) allocation with degree, sharing rule for shared rows and justification answering the three questions; (4) both named scales in every cell, before and after; (5) mitigation with action, owner, verifier, date and status; (6) premium with published scale, rate and cap, and retained/transferred split; (7) tail with distribution per row, N and seed, and the independence warning; (8) frontier verdict per row read as an order, with no infeasible ones; (9) clause per row and list of silences, with rows carrying payment identified for M2; (10) matrix version on every figure; (11) a note on what the tool did and what was done by hand. The eleven points follow the format of the Value for Money, Eligibility and Payment Mechanisms manuals; the ten‑step diagram accompanies the table if the publication format allows it.
This section's method allocates, rates and values one contract. What happens when the matrices of many contracts are added up is a different discipline, with its own manual (M9, which receives the portfolio), and this half‑page only fixes the frontier with a minimum three‑point rule, by analogy with the rebalancing frontier in the Payment Mechanisms manual.
First, what is added up is not redone. Steps 5 and 6 produce, for each contract, the mean and the tail of its retained book, with its matrix's version; Step 8, its rows with a clause and its silences. The portfolio adds up those outputs: a contract whose matrix has no version cannot enter a portfolio, because next year's portfolio would not know whether the risk changed or the matrix changed.
Second, three things change hands. Correlation: Step 6 sums independently and says so; in the portfolio, risks a macro shock triggers all at once — the exchange‑rate guarantee, the demand guarantee, twenty contracts' revenue floors — are called on together, and the retention cost r rises with the correlation of the retained book (Austral, Stress‑Testing PPP Portfolios; the frontier's correlated variant, §2.6 and §5.6). The ceiling: the bankability ceiling is per contract; the commitments ceiling is the portfolio's (M2, Step 8), and a matrix that retains the right amount in each contract can still add up to more than the ceiling allows. The reserve: the tail the finance ministry compares with its reserve is the portfolio's, not the sum of the per‑contract tails. The portfolio tools the Risk Platform hosts under the same route are named in one line in §5.9 and are not taught here.
Third, the finance ministry sends the instruction back to the next contract. Per contract, the PPP unit allocates and the finance ministry admits the retention (§1.3); at the portfolio level, the finance ministry decides how much retained risk fits under the ceiling and with what reserve, and sends the PPP unit the instruction to retain less — or to guarantee at a price — in the next contract (Austral, From Gatekeeper to Orchestrator). This is the link this manual leaves in writing, and M9 develops it.
This section runs the nine steps of §3 on one contract the series' reader already knows — the 300‑bed regional hospital paid by availability from the Value for Money and the Public Sector Comparator manual, the same one Eligibility declared fit and Payment Mechanisms sized net of deductions — and shows what this manual does with it that the earlier ones did not: building the register from the sector catalogue, allocating with the three questions and justifying row by row, rating on both scales before and after mitigation, splitting the expected premium into what the State retains and what the partner bears, valuing the tail of the retained book, testing the allocation against the retention frontier, and tying every row to its clause or to the list of silences. A one‑page counterpoint, the Coastal Highway Expansion from the Fiscal Commitments and Contingent Liabilities manual, shows the exact point where this manual hands off to the fiscal register: rows with a clause go to be valued; rows with no clause stay in the matrix. And a box takes the banded distribution rule from Chile's 2023 tender documents and values it in the tail. Both contracts are generic — no client's data — the hospital is the Risk Platform's and the Value for Money module's demonstration pack; the Coastal Highway is one of the contracts in the fiscal register's demonstration portfolio.
Every figure comes from running the platform's engines the same way the screens do, with a reproducible script that prints them (annex 4.A): the Risk Platform's sector catalogue and fiscal taxonomy; the "hospital" scenario the module ships as a demonstration pack, with its ten risks, its allocation, its fiscal assessment and its register; the two scales' rating rules, exactly as the engine returns them; the comparator engine for the expected premium, with the Value for Money manual's scale and cap and its two rate conventions — two rates, 2.70% risk‑free plus 0 / 0.90% spread, that manual's base case; and a single rate of 5.5%, its comparative reading; the tail's quantitative layer with N 10,000 and seed 42; and the allocation diagnostic against the retention frontier, through the API, with the paper's illustrative calibration. No figure is written by hand except two the text declares as such: Step 6's dollar bands, which are the Value for Money manual's published scale applied to the retained fraction, and the sharing formula in the bands box, which is the contract's own arithmetic. Figures in millions of US dollars (US$M) for the hospital and the Coastal Highway, and in unidades de fomento (UF) in the Chilean box, unconverted.
Three reading warnings. First: cross‑references in parentheses cite §5's figures, taken from the hospital's demonstration pack; the platform's own exact strings — row names and the demonstration scenario's justifications — are quoted between ⟨…⟩ wherever the text depends on exactly what the screen shows. Second: the demonstration scenario and the comparator's register are the same matrix in two vocabularies: the scenario allocates by party — Public, Private, Shared — and the comparator by five degrees — from fully retained to fully transferred; the two match row for row under the majority‑share rule, and the text shows this in Step 2 instead of assuming it. Third: wherever the engine cannot measure something the method asks for — the expected premium inside the Risk Platform, the tail in money with no declared bands, renegotiation's frontier class, the matrix as a tender‑document annex — the text says so and shows how it was declared.
The hospital. US$150M investment, three years of works from 2026, a 20‑year contract to 2045, an availability payment of 36.0 a year from 2029 with 2% contractual escalation, no user revenue, no construction subsidy, 80/20 financing. The Value for Money manual compared it and gave it a value for money of +5.8% at two rates and +6.4% at one, positive by a narrow margin, with a ten‑risk register whose expected premium — 117.05 against a ceiling of 126.15 — is half of the verdict's explanation. This manual takes that same register from the other end: not how much it is worth but where it came from, why each row is allocated as it is, what was left out, what would happen with a different allocation, and what clause each row has.
Why the hospital and not another contract. Three reasons. It is the series' contract whose matrix is already valued in the comparator, so this manual's Step 5 and that manual's Step 5 are the same calculation, and the reader can check that nothing is recalculated. It is an availability contract in a social sector, where the allocation has the form the guides consider canonical — works and life cycle to the partner, clinical demand to the State — and where, even so, the retention frontier has something to say on six of the nine rows. And it exists on the Risk Platform as a demonstration pack, with its ten risks loaded from the hospital sector catalogue, so the reader reproduces on screen what is printed here.
Why the Coastal Highway as a counterpoint. Because it is a mixed contract — toll, availability payment, minimum revenue guarantee, debt guarantee, termination compensation — and its matrix has the two classes of row this manual distinguishes: five with a payment clause, which the Fiscal Commitments manual valued (the revenue guarantee at an expected 68.0 over the contract's life, the debt guarantee at 26.4, termination at 24.5), and five with no clause, which that manual left in the matrix with probability and impact and no money. This is the page where this manual shows what it hands off and what it does not.
The profile (Step 0). The Risk Platform stores what the method's framework requires for the hospital: name, country, catalogue sector, type, cycle stage, investment, term, construction period, payment mechanism, revenue model, government support, market maturity and legal system (figure 5.2). Alongside it, what the Value for Money module stores for the same hospital to value it:
| Field | Risk Platform scenario | Comparator pack |
|---|---|---|
| Catalogue sector · type | hospital · Hospital | — |
| Cycle stage | appraisal | — |
| Investment (US$M) | 150 | 150.0 (design 8.0, land 7.0, works and equipment 120.0, other 15.0) |
| Works · term | 3 years · 20 years | 3 years (30/40/30%) · 20 years, 2026–2045 |
| Payment mechanism · revenue model | availability · government payments, base 36.0/year, +2%/year | availability payment 36.0 from 2029, +2%; no user revenue |
| Government support · market maturity · legal system | none · developing · civil law | — |
| Financing | 80/20 | 80/20, two tranches; required cover 1.20 |
| Comparator adjustments | — | competitive neutrality 12% of investment PV; oversight 2% of investment per year; probability × impact risk model with a 30% cap |
The profile decides two things about the method before a single row exists: the sector fixes the starting catalogue — the Risk Platform loads 18 sectors from the Global Infrastructure Hub's catalogue, and "hospital" is one of the five in social infrastructure — and the payment mechanism fixes in advance the destination of demand risk, which under an availability contract is retained by design (Step 2). The taxonomy that will govern the register is also declared here: PFRAM's eleven categories as the backbone, the sector catalogue as the detail, and the correspondence between the two — this manual's header table — as the rule that stops "land risk" and "expropriations" from becoming two different rows in two different documents.
The hospital sector catalogue. Sixteen categories and 47 sub‑risks, each with the typical allocation the catalogue recommends for this sector — where clinical services stay with the contracting authority and the concession company designs, builds, finances, operates the non‑clinical side and maintains. The table shows the sixteen, how many sub‑risks each carries, how the catalogue allocates them, which fiscal category they correspond to, and which enter the hospital's valued register (figure 5.4, the matrix loaded from the "hospital" catalogue):
| Catalogue category | Sub‑risks | Catalogue's typical allocation | PFRAM category | In the valued register |
|---|---|---|---|---|
| Land and site | 6 | 5 public, 1 shared | 2 Construction | yes |
| Social | 3 | 1 public, 1 private, 1 shared | 2 Construction | not applicable, with reason |
| Environmental | 3 | 1 public, 1 private, 1 shared | 2 Construction | not applicable, with reason |
| Design | 3 | 1 public, 1 private, 1 shared | 2 Construction | yes |
| Construction | 5 | 4 private, 1 shared | 2 Construction | yes |
| Variations | 2 | 1 public, 1 private | 2 Construction | yes |
| Operation | 4 | 2 private, 2 shared | 4 Operation and performance | yes |
| Demand | 2 | 2 public | 3 Demand | yes |
| Financial markets | 4 | 1 private, 3 shared | 5 Financial | not applicable, with reason |
| Strategic / counterparty | 3 | 2 private, 1 shared | 7 Adverse government action | yes |
| Disruptive technology | 1 | 1 shared | 4 Operation and performance | yes |
| Force majeure | 2 | 1 public, 1 shared | 6 Force majeure | not applicable, with reason |
| Adverse government action (MAGA) | 2 | 2 public | 7 Adverse government action | not applicable, with reason |
| Change in law | 2 | 1 private, 1 public | 8 Change in law | yes |
| Early termination | 3 | 2 public, 1 private | 11 Termination | not applicable, with reason |
| Handback condition | 2 | 2 private | 4 Operation and performance | yes |
Two things the catalogue teaches before a single row is written. First, the typical allocation is by sub‑risk, not by category: within "Design," design suitability is the partner's, the approval process is shared, and design changes requested by the authority are the State's — three rows with three allocations under one label — and within "Change in law," a general change is the partner's and a discriminatory one is the State's, exactly the Australian guides' rule from §2.4. A matrix that allocates by category loses that information and rediscovers it in a dispute. Second, the catalogue says what can go wrong, not what happens to the State: the correspondence column with PFRAM is what the finance ministry reads, and six catalogue categories fall into a single PFRAM one (construction), while "Strategic / counterparty" falls into adverse government action. The header table is what supports that dual reading.
The hospital's register has ten rows, one per catalogue category, in the order the comparator values them (figure 5.10):
| Row | Risk | Catalogue category | PFRAM category | Phase | Trigger (what makes it happen) |
|---|---|---|---|---|---|
| 1 | Design (medical programme and standards) | Design | 2 Construction | Pre‑construction | A change in the medical programme or design standard after the bid |
| 2 | Land, permits and soil | Land and site | 2 Construction | Pre‑construction | A site condition different from the one studied; a delayed permit |
| 3 | Works cost overrun | Construction | 2 Construction | Construction | Price, time or quantity of works above the construction contract |
| 4 | Commissioning and equipment integration | Variations | 2 Construction | Construction | Medical equipment not integrated into the building by opening date |
| 5 | Building‑management services cost | Operation | 4 Operation and performance | Operation | Non‑clinical service cost above the bid |
| 6 | Maintenance and availability deductions | Handback condition | 4 Operation and performance | Operation | Unavailability of areas; deductions from payment |
| 7 | Life cycle and equipment replacement | Disruptive technology | 4 Operation and performance | Operation | Obsolescence or failure of equipment before scheduled replacement |
| 8 | Regulatory and clinical‑standards change | Change in law | 8 Change in law | Operation | A new health regulation requiring works or an additional service |
| 9 | Clinical demand / bed occupancy | Demand | 3 Demand | Operation | Actual occupancy different from the bed‑day table |
| 10 | Renegotiation | Strategic / counterparty | 7 Adverse government action (in the catalogue); 10 Renegotiation (in the fiscal reading) | All | A compensation claim or supplementary agreement over any of the rows above |
The demonstration scenario's row names and justifications are stored in English ⟨Design changes and scope creep, Land, permits and soil conditions, …⟩; annex 4.A gives the correspondence list.
The six that do not apply, with reason. The method requires recording what is left out and why, because "not applicable" is a decision, not an omission. Social: the site is public land and there is no resettlement; it stays in the fiscal assessment by category (construction), not as a row. Environmental: the urban hospital has no environmental ruling with additional measures at the scale that justifies its own row; the measures for new investments are the partner's by contract (box 4.9a), and the row would open if the site changed. Financial markets: inflation enters through the 2% contractual escalation and there is no foreign‑currency debt; refinancing is the partner's; it stays in the fiscal reading (financial, medium × medium). Force majeure: covered by catastrophe insurance and the rule that the State does not contribute to repair; it stays in the fiscal reading (low × medium, unmitigated, with a note on seismic exposure) and is the first row in Step 8's list of silences, because it has insurance and no rule on time and money. Adverse government action: in the fiscal reading, low × low with standard contractual protections. Early termination: in the fiscal reading, with the termination payment formula fixed in advance; the risk of losing the construction subsidy on extinction for serious default is the row Chilean hospital tender documents call "financial risk distribution" (box 4.9a).
What the register shows that the guides do not say: row 10, renegotiation, is not a sector‑catalogue risk — the catalogue keeps it under "strategic / counterparty" — and it is not a works risk or an operation risk: it is the consequence of any of the other nine being badly written. The comparator values it only in the PPP branch, retained at 100%, because public works does not have it; this manual keeps it in the register so that every step shows it is the most expensive row in the retained book (Step 6) and the only one with no frontier class (Step 7).
The hospital's allocation is justified row by row with Irwin's three questions — who reduces the probability, who reduces the impact, who absorbs it more cheaply — and Austral's fourth — how far the partner will accept it at any price. The table shows the decision, the fraction the State retains and the justification (figure 5.4, the hospital's matrix with the public/private/shared bar and the per‑row justification):
| Risk | Who reduces the probability? | Who reduces the impact? | Who absorbs it more cheaply? | Allocation | Retained by the State | Sharing rule and justification |
|---|---|---|---|---|---|---|
| Design (medical programme and standards) | The partner, with a closed design before close; the State, by not changing the programme | The partner | The partner, except for changes the State requests | Mostly transferred | 20% | Fixed‑scope contract; the 20% retained is the programme change the authority requests, which the catalogue allocates to the State |
| Land, permits and soil | Neither, fully: the site is what it is | The State on permits, the partner on soil engineering | Shared | Shared | 50% | Half and half: neither party controls the site condition; it is the cleanest row for "shared" and needs a written rule (a geotechnical baseline, like the 2013 Chilean tender documents') |
| Works cost overrun | The partner, through its contractor | The partner | The partner, which diversifies it across its portfolio of works | Fully transferred | 0% | Fixed price and performance bonds; it is the register's highest‑premium row and the one that creates the most value by being transferred |
| Commissioning and equipment integration | The partner (integrated design and build) | The partner | The partner | Fully transferred | 0% | Integration is the design‑and‑build consortium's |
| Building‑management services cost | The partner | The partner, through the deduction regime | The partner | Mostly transferred | 20% | Deductions by indicator cap the operator's exposure; the 20% retained is the service the State redefines |
| Maintenance and availability deductions | The partner | The partner | The partner | Fully transferred | 0% | The availability deduction is the contract's mechanism for poor performance |
| Life cycle and equipment replacement | The partner, with its replacement plan | The partner, with the life‑cycle reserve account | The partner | Fully transferred | 0% | Replacement every three years funded by the reserve account |
| Regulatory and clinical‑standards change | The State, which sets the standard | The State, which decides how it is met | The State | Mostly retained | 80% | Change‑in‑law clause with compensation; the residual 20% is the general change with a threshold the guides leave to the partner |
| Clinical demand / bed occupancy | The State, which controls patient referrals | The State, with the bed‑day table | The State | Fully retained | 100% | Availability contract: occupancy is systematic and is valued in the rate, not in the cash flow; there is no one to transfer it to |
| Renegotiation | Both parties, by writing the other nine rows well | The State, through the general closing rule | The State | Fully retained | 100% | The State bears the consequence of its own silences; it is the row that moves the retained book most |
The two ways of storing the same allocation. The Risk Platform stores per row a party — Public, Private, Shared — and a justification; the comparator stores per row one of five degrees that translate into the retained fraction (100, 80, 50, 20, 0%). The rule linking them is the allocation screen's: the party is the majority share, and a tie goes to shared. Applied to the five degrees, it matches the demonstration scenario row for row: three public rows (regulatory change, demand, renegotiation), six private and one shared (land). What is lost in translation is the degree: the 20% retained in design and in building‑management services, and the 80% in regulatory change, do not exist in the scenario's three‑party vocabulary; they exist in the percentage matrix of the allocation screen and in the comparator's register, which is where they are valued. The manual teaches with both and declares which one produces the figure (Step 5). And the summary the screen returns on save (figure 5.6): Public 3 · Private 6 · Shared 1.
The cross‑sector comparison (figure 5.5) is useful for justifying the row that is discussed most: demand is public in the hospital catalogue's two rows and shared or private on highways; the same category in two sectors with two dominant allocations, and the reason — who controls the volume — is Irwin's first question. It is the catalogue page a committee asks for when someone proposes "transferring demand because it creates value"; Step 7 puts a figure on it.
The fiscal reading: PFRAM, three by three, by category. The hospital's fiscal assessment rates PFRAM's eleven categories with probability and impact on three levels, says whether there is mitigation, who is responsible and what the strategy is; the engine returns the rating and the priority under the published rule (figures 5.7 and 5.8, the latter a quick assessment of one cell with the framework's name in the response):
| # | PFRAM category | Probability | Impact | Rating | Mitigated | Priority | Responsible · strategy |
|---|---|---|---|---|---|---|---|
| 1 | Governance | low | low | low relevance | yes | accept | Ministry of Health · experienced hospitals unit |
| 2 | Construction | high | high | critical | yes | plan mitigation | Contracting authority · fixed price with performance bonds |
| 3 | Demand | low | low | low relevance | yes | accept | Ministry of Health · availability payment takes demand out of the premium; valued in the rate |
| 4 | Operation and performance | medium | high | high | yes | monitor | Contracting authority · deductions by indicator; life‑cycle reserve account |
| 5 | Financial | medium | medium | medium | yes | monitor | Finance ministry · 80/20, senior debt amortised over the term |
| 6 | Force majeure | low | medium | low | no | monitor | — · seismic exposure |
| 7 | Adverse government action (MAGA) | low | low | low relevance | yes | accept | Ministry of Health · standard contractual protections |
| 8 | Change in law | low | medium | low | yes | accept | Ministry of Health · change‑in‑law clause with compensation |
| 9 | Financial rebalancing | low | low | low relevance | no | accept | — |
| 10 | Renegotiation | medium | high | high | no | plan mitigation | — · the comparator's biggest premium driver |
| 11 | Termination | low | medium | low | yes | accept | Finance ministry · termination payment formula fixed in advance |
The scenario's fiscal mix, exactly as recalculating it returns: low 7, medium 1, high 2, critical 1 (figure 5.9, the 3 × 3 heat map by category and by project). Three readings. Construction is critical and allocated to the partner: PFRAM does not say this is an error — it says what would happen to the State if the transfer failed — and Step 9's consistency check flags it exactly that way. Renegotiation is high and unmitigated, the only category whose priority is "plan mitigation" with no mitigation at all: it is register row 10 seen from the finance ministry. And demand is low relevance on the fiscal reading while register row 9 rates it medium × high: this is not a contradiction but two questions — the fiscal one asks whether the State's payment changes with occupancy, and under availability it does not; the register asks whether the risk exists, and for the ministry's budget it does; the consistency check does not compare the two, and the manual notes this as a limit (§5 and §6.1).
The full grid rule, exactly as the engine returns it, matches PFRAM 2.0's figure 7 cell for cell ("low relevance" where PFRAM says "irrelevant"); the priority rule collapses figure 8's five levels into four and differs in one cell — unmitigated medium is "high priority" in PFRAM and "monitor" on the screen — which the manual declares and does not silently correct.
The operational reading: the five‑by‑five grid, by row, before and after. The register rates each row on five levels of probability and impact, a score of 1 to 25 and four bands — 1–4 low, 5–9 medium, 10–16 high, 20–25 critical, Austral's convention on the Orange Book grid APMG recommends with no fixed bands — before and after Step 4's mitigation (figure 5.11):
| Risk | Before: P × I | Score · band | After: P × I | Score · band | The same "before" cell read on PFRAM's 3×3 |
|---|---|---|---|---|---|
| Design | medium × medium | 9 · medium | medium × low | 6 · medium | medium |
| Land, permits and soil | medium × low | 6 · medium | low × low | 4 · low | low |
| Works cost overrun | high × high | 16 · high | medium × medium | 9 · medium | critical |
| Commissioning and integration | medium × low | 6 · medium | low × low | 4 · low | low |
| Building‑management services | medium × high | 12 · high | medium × medium | 9 · medium | high |
| Maintenance and deductions | medium × high | 12 · high | low × medium | 6 · medium | high |
| Life cycle and replacement | medium × high | 12 · high | low × medium | 6 · medium | high |
| Regulatory change | low × medium | 6 · medium | low × low | 4 · low | low |
| Clinical demand | medium × high | 12 · high | medium × high | 12 · high | high |
| Renegotiation | medium × high | 12 · high | medium × medium | 9 · medium | high |
The register's residual density, exactly as recalculating the scenario returns it: low 3, medium 6, high 1. What the last column teaches is §3's rule: the two scales are not silently harmonised. High × high is "high" (16) on the five‑level grid and "critical" on the three‑level one, and both are correct on their own grid; what is compared across scales is the order — the works cost overrun is first on both — not the label. A report that put "critical" on the fiscal reading and "high" on the register with no note on which grid each is from would be contradicting itself without knowing it.
Where they differ, and why it matters. Clinical demand is the only row that does not drop after mitigation: 12 before, 12 after. No mitigation reduces a hospital's actual occupancy — it is the State that refers patients — and the row stands as the register's only residual "high," which is exactly what monitoring will show as an alert (Step 9). It is correct that it stays this way: retained clinical demand is not a risk that gets mitigated but one that gets paid for, and Chilean hospital tender documents pay for it with a variable per‑bed‑day subsidy and over‑demand compensation (box 4.9a): it is a retained row with a clause, which is why it goes to the Fiscal Commitments manual.
The hospital's register stores, for each row, the action, the owner and the status, and the residual rating (figures 5.7 and 5.10):
| Risk | Action (contractual or managerial) | Owner | Verifier | Status | Residual |
|---|---|---|---|---|---|
| Design | Contractual: fixed scope; programme change only through a priced variation | Partner (design); Ministry (programme) | Site inspector | Open | medium × low |
| Land, permits and soil | Managerial: public site handed over and soil study done before signature; contractual: geotechnical baseline | Ministry (site); partner (engineering) | Site inspector | In monitoring | low × low |
| Works cost overrun | Contractual: fixed price, performance bonds | Partner | Site inspector | Open | medium × medium |
| Commissioning and integration | Contractual: commissioning date with penalty; managerial: integrated testing | Partner | Site inspector | In monitoring | low × low |
| Building‑management services | Contractual: deduction regime by indicator | Partner | Site inspector and health service | Open | medium × medium |
| Maintenance and deductions | Contractual: unavailability deduction with a rectification period | Partner | Site inspector | In monitoring | low × medium |
| Life cycle and replacement | Contractual: life‑cycle reserve account; replacement every three years | Partner | Site inspector | In monitoring | low × medium |
| Regulatory change | Contractual: change‑in‑law clause with compensation and threshold | Ministry | Technical Panel if there is disagreement | In monitoring | low × low |
| Clinical demand | None that reduces occupancy; contractual: variable per‑bed‑day subsidy and over‑demand compensation | Ministry / health service | Finance ministry (fiscal register) | Open | medium × high |
| Renegotiation | Managerial: writing the other nine rows well; contractual: general closing rule | PPP unit | Comptroller general | Open | medium × medium |
Two things the screen does not have and the method requires, stated as a limit. The register has an owner field, but the demonstration scenario fills it with the party — ⟨Public⟩ or ⟨Private⟩ — and not with an entity or a person, so Step 9's "mitigation with no owner" check passes without there being a real owner; the manual writes the owner in the column above and declares this. And there is no verifier field: the column is the method's, not the screen's, and is carried in the row's notes until it exists. PFRAM's priority rule already said where to put the effort: construction (critical, mitigated: plan) and renegotiation (high, unmitigated: plan), and no other row.
The mitigation that moves a risk to another row. Catastrophe insurance turns force majeure into coverage risk and premium risk — does it cover the design earthquake?, who is the beneficiary?, what happens if the premium rises? — the life‑cycle reserve account turns equipment replacement into a risk of the account's adequacy; the fixed price turns cost overrun into the contractor's counterparty risk. None of the three lowers the probability of the event; they lower the impact on the State and create a new row, and the register stores them as what they are.
The premium is valued with the Value for Money manual's rule: probability × impact × present value of the phase's cost base, with the published scale — probability very low 0.05 · low 0.20 · medium 0.50 · high 0.75 · very high 0.90; impact < 1% 0.005 · 1–3% 0.02 · 3–10% 0.065 · 10–25% 0.175 · > 25% 0.35 — and the 30% cap on the sum of the bases carrying risk. This manual does not recalculate it: it produces it with the same engine and shows what the comparator does not, the split between what the State retains and what the partner bears (figure 5.16, the comparator's risk allocation with the premium preview; the Value for Money manual's figure is reused). At two rates — that manual's base case, with the bases at the comparator's rate, 2.70%:
| Phase | Risk | Nature · where valued | p | i | PV base | Premium (comparator carries 100%) | Retained | Retained premium (State, PPP) | Transferred premium (partner) |
|---|---|---|---|---|---|---|---|---|---|
| Construction | Design | specific · cash flow | 0.50 | 0.175 | 146.1 | 12.78 | 20% | 2.56 | 10.23 |
| Construction | Land, permits and soil | specific · cash flow | 0.50 | 0.065 | 146.1 | 4.75 | 50% | 2.37 | 2.37 |
| Construction | Works cost overrun | specific · cash flow | 0.75 | 0.175 | 146.1 | 19.17 | 0% | 0.00 | 19.17 |
| Construction | Commissioning and integration | specific · cash flow | 0.50 | 0.065 | 146.1 | 4.75 | 0% | 0.00 | 4.75 |
| Operation | Building‑management services | specific · cash flow | 0.50 | 0.175 | 274.4 | 24.01 | 20% | 4.80 | 19.21 |
| Operation | Maintenance and deductions | specific · cash flow | 0.50 | 0.175 | 274.4 | 24.01 | 0% | 0.00 | 24.01 |
| Operation | Life cycle and replacement | specific · cash flow | 0.50 | 0.175 | 274.4 | 24.01 | 0% | 0.00 | 24.01 |
| Operation | Regulatory change | specific · cash flow | 0.20 | 0.065 | 274.4 | 3.57 | 80% | 2.85 | 0.71 |
| Demand | Clinical demand | systematic · rate | 0.50 | 0.175 | 0.0 | — | 100% | — | — |
| Sum | 117.05 | 12.59 | 104.46 | ||||||
| PPP only | Renegotiation | specific · cash flow | 0.50 | 0.065 | 420.5 | — (does not enter the comparator) | 100% | 13.67 | — |
The gross premium is 117.05 against a ceiling of 126.15: 9.10 below it, a 7.2% margin, so no row is scaled. Of that premium the State retains under the PPP 12.59 — 10.8% — and transfers 104.46 — 89.2%; by phase, construction carries 41.45 and retains 4.93, operation carries 75.60 and retains 7.66. Add renegotiation, which exists only in the PPP branch and is retained in full: 13.67. The State's retained book under the PPP is then 26.25 at two rates: 12.59 from the register's nine rows plus 13.67 from the tenth. This is the figure this manual hands to Step 6, and the one the comparator never prints as such, because what interests it is the difference between the branches (104.46 of transferred risk minus 13.67 of renegotiation, plus everything else: the value for money of +32.0, +5.8%).
At a single rate of 5.5%, that manual's comparative reading, the bases are smaller (142.3 and 206.9) and everything scales proportionally: gross premium 97.37 against a ceiling of 104.75; retained 10.57 (10.9%); transferred 86.79; renegotiation 11.35; retained book 21.92; value for money +29.5, +6.4%. The proportions do not change with the rate; the level does, and the manual publishes the convention with the figure.
The row that is not in the book. Clinical demand is in the register, rated high, retained at 100% and with no premium: its base — the present value of user revenue — is zero in an availability hospital, and under the two‑rate convention it is also systematic and is valued in the rate, not the cash flow. Since the State retains it under both procurement modes, it neither creates nor destroys value for money; but for the ministry's budget it exists, and the variable per‑bed‑day subsidy in the Chilean tender documents is the proof: it is a row retained with a clause and no premium in the comparator, which the Fiscal Commitments manual values over the distribution of occupancy. Step 5 declares this and sends it there.
The comparator produces the mean; the finance ministry needs the tail. The Risk Platform's quantitative layer sums independent risks, each with its own distribution and probability of occurrence, and returns the distribution of total loss, the value at risk and the expected shortfall in the tail at 90, 95 and 99%, with N and seed declared (figure 5.13). Two runs, worth telling apart.
What the screen preloads. From the saved register, the layer translates the probability and impact labels into a probability of occurrence (0.1 / 0.3 / 0.5 / 0.7 / 0.9 per level) and a triangular band in abstract loss units (mode 1 / 5 / 15 / 40 / 80 per impact level; minimum 0.4 and maximum 2.5 times the mode) ⟨the ten rows, with their bands, on screen⟩. Over the hospital's ten rows, N 10,000, seed 42: mean 189.3, VaR95 314.5, CVaR95 344.3 — in units that are not money. It is an editable starting point and the screen says so; the manual does not use it as a figure, because a tail with no monetary base cannot be compared with a reserve, and because the preload's probability scale (0.7 for "high") is not the comparator's (0.75), two scales on the same platform §6.3 picks up.
The retained book in dollars. The same layer, with bands declared from the comparator's scale: for each retained row, a triangular with minimum, mode and maximum at the lower bound, the point value and the upper bound of its impact band — 3 to 10% with 6.5% as the point value; 10 to 25% with 17.5% — as a fraction of the present value of its phase's base at two rates, multiplied by the retained fraction; probability of occurrence, the comparator's p. Each triangular's mean is its point value, so the simulation's mean has to reconcile with Step 5's retained premium, and it does:
| Retained row | Retained | p | Min | Mode | Max | p × mode |
|---|---|---|---|---|---|---|
| Design | 20% | 0.50 | 2.92 | 5.11 | 7.30 | 2.56 |
| Land, permits and soil | 50% | 0.50 | 2.19 | 4.75 | 7.30 | 2.37 |
| Building‑management services | 20% | 0.50 | 5.49 | 9.60 | 13.72 | 4.80 |
| Regulatory change | 80% | 0.20 | 6.59 | 14.27 | 21.95 | 2.85 |
| Renegotiation | 100% | 0.50 | 12.61 | 27.33 | 42.05 | 13.67 |
| Clinical demand | 100% | 0.50 | — | — | — | outside the book: zero base, systematic, in the rate |
| Five rows fully transferred | 0% | outside the book |
Five rows, N 10,000, seed 42, independent: mean 26.49 (against 26.25 deterministic), median 26.33, standard deviation 16.57, maximum 78.53; the loss is zero in 4.7% of draws — none of the five occurs.
| Confidence | VaR | CVaR (expected shortfall in the tail) | VaR / mean |
|---|---|---|---|
| 90% | 48.83 | 55.21 | 1.84 |
| 95% | 53.48 | 59.40 | 2.02 |
| 99% | 62.99 | 67.09 | 2.38 |
Contribution to the mean: renegotiation 13.87 (52.4%), building‑management services 4.87 (18.4%), regulatory change 2.83 (10.7%), design 2.53 (9.5%), land 2.38 (9.0%). Check: with N 5,000 — the screen's default — the mean is 26.38 and VaR95 52.79; with a different seed, 26.34 and 53.69. What the tail says that the mean does not: the State retains 26 of risk in expectation, but one bad year in twenty costs it more than double, and half of that tail is the row no contract writes down — renegotiation. This is the figure the finance ministry compares with its reserve; the mean is what enters the comparator.
What the layer does not do, stated plainly. It sums independently: it does not correlate demand with inflation or with the exchange rate, which a macro shock triggers all at once; for the hospital, with a zero demand base and no dollar debt, this does not bite, and the manual says so; for a highway with a revenue guarantee and indexation it would bite, and that case goes to the portfolio stress test in the series manual that receives the portfolio and to the frontier's correlated variant (Step 7). And it carries no monetary base of its own: the dollar bands are the method's, not the screen's; the expected premium per row inside the module is a declared limitation of §5.
Austral's retention frontier (§2.6) turns Step 2's three questions into a figure per risk: efficient retention α* = p / (p + 2m + r), bounded by the bankability ceiling, and each transfer's real contribution to value for money, M − P, the management gain net of the premium paid. The comparator's allocation diagnostic takes the observed matrix — each row's name and retained fraction — and returns, per row, the frontier class, α*, the verdict and M − P. It has no screen: it is called through the API, with the paper's illustrative calibration, and the robust result is the order, not the figure.
How the matrix goes in. The diagnostic assigns the frontier class by keyword matching on the row name, and with the demonstration scenario's English names it gets eight of ten right and two wrong — it reads "permits" as a political risk and "building" as construction ⟨the mapping table, if the screen exposed it⟩; the class is forced per row with the field provided for that, and the manual declares it: construction for the four works rows, operation and maintenance for the three operation rows, political / change in law for regulatory change, demand for clinical demand. Renegotiation has no frontier class: the paper treats it as the consequence of a badly made allocation, not as a risk that gets allocated, and the diagnostic returns it with no class; the manual leaves it out of this test and inside every other one.
| Risk | Frontier class | Observed α | α* (ceiling τ_max) | Verdict | M − P | Reading |
|---|---|---|---|---|---|---|
| Design | construction | 20% | 9% (1.00) | over‑retained | +1.248 | creates value; more could be transferred |
| Land, permits and soil | construction | 50% | 9% (1.00) | over‑retained | +1.012 | creates value; the "construction" class does not distinguish the site, which the catalogue places with the State |
| Works cost overrun | construction | 0% | 9% (1.00) | on the frontier | +1.250 | creates value: the canonical transfer |
| Commissioning and integration | construction | 0% | 9% (1.00) | on the frontier | +1.250 | creates value |
| Building‑management services | operation and maintenance | 20% | 12% (1.00) | on the frontier | +1.216 | creates value |
| Maintenance and deductions | operation and maintenance | 0% | 12% (1.00) | under‑retained (two points outside the band) | +1.200 | creates value |
| Life cycle and replacement | operation and maintenance | 0% | 12% (1.00) | under‑retained (same) | +1.200 | creates value |
| Regulatory change | political / change in law | 80% | 85% (0.15) | infeasible transfer (the 20% transferred exceeds the 15% ceiling) | +0.044 | barely creates value: the fraction transferred is the general change with a threshold |
| Clinical demand | demand | 100% | 57% (0.90) | over‑retained | 0.000 | nothing is transferred: neither creates nor destroys |
| Renegotiation | — | 100% | — | no class | — | outside the test |
Engine summary: eight transfers create value, one neither creates nor destroys, one has no class; six of nine rows fall outside the ±10‑point band around the frontier, with an excess deadweight loss of 0.93 cost units; the observed matrix's sum of τ·p (3.11) is lower than the efficient one's (4.39) — that is, the hospital's matrix transfers less project risk than the frontier would allow, not more. How it is read, in order and not in decimals:
The contrast: transferring demand. The same row, with the State retaining less and less each time:
| Clinical demand: observed α | α* | Verdict | M − P | Excess deadweight loss |
|---|---|---|---|---|
| 100% (the example's matrix) | 57% | over‑retained | 0.000 | 0.554 |
| 50% (shared by band) | 57% | on the frontier | +0.312 | 0.017 |
| 20% (mostly transferred) | 57% | under‑retained | −0.160 | 0.426 |
| 10% (the doctrinal allocation) | 57% | under‑retained | −0.427 | 0.685 |
| 0% (fully transferred) | 57% | infeasible transfer | −0.750 | 1.004 |
Transferring clinical demand to the partner destroys value from 20% retained downward — the State pays the premium p and gets no management gain m — and is infeasible at 100%: no lender will take on the occupancy of a public hospital with no guarantee, and the guarantee is the State retaining under another name. A comparator that credited that transfer at full premium — a "medium × 10–25%" demand row on a revenue base is worth, with the same probability and impact, what the same‑size operation row is worth: 24.01 on a 274.4 base — would book value created where the frontier shows value destroyed. And since the hospital's value for money rests entirely on the transfer of works and life‑cycle risk (104.46 transferred against 13.67 of renegotiation), the verdict's sign flips with demand transferred before anyone has written the payment formula: the Payment Mechanisms manual showed the same hospital, paid per bed‑day, flipping its verdict; this manual shows why, from the matrix. It is described with the matrix and with no new comparator figures: the hospital's value for money is that manual's, +5.8% at two rates and +6.4% at one, and it is only cited here.
The paper's example, through the same call. With no risk vector, the frontier returns the seven‑risk example from The Optimal Risk‑Retention Frontier with the doctrinal allocation of transferring almost everything, and it is the table §5 reproduces through the API:
| Risk | p | m | r | τ_max | efficient α | α* | observed α | Verdict | M − P |
|---|---|---|---|---|---|---|---|---|---|
| Construction | 0.30 | 1.40 | 0.20 | 1.00 | 9% | 9% | 10% | on the frontier | +1.264 |
| Operation and availability | 0.40 | 1.40 | 0.20 | 1.00 | 12% | 12% | 10% | on the frontier | +1.224 |
| Demand (traffic) | 3.50 | 1.00 | 0.60 | 0.90 | 57% | 57% | 10% | under‑retained | −0.427 |
| Exchange rate | 3.50 | 0.30 | 0.75 | 0.60 | 72% | 72% | 15% | infeasible transfer | −0.971 |
| Inflation / indexation | 2.50 | 0.30 | 0.50 | 0.80 | 69% | 69% | 20% | under‑retained | −0.512 |
| Force majeure | 1.60 | 0.44 | 0.40 | 0.60 | 56% | 56% | 50% | on the frontier | +0.130 |
| Political / change in law | 5.00 | 0.40 | 0.40 | 0.15 | 81% | 85%, forced by bankability | 60% | infeasible transfer | −0.144 |
Four of seven misallocated, excess deadweight loss of 2.05 units; the observed sum τ·p, 11.56, against 5.32 efficient: the doctrinal allocation pays 6.24 units of extra cost‑of‑capital cost for transfers it should have retained. The three macro risks destroy value; the two project risks create it; force majeure is on the frontier shared by halves; and political risk is the case where bankability forces retention above efficiency. The correlated variant (λ 0.5) loads the fiscal‑space charge with the retained book's correlation — book correlation 2.04 — and lowers the efficient retention of the three macro risks (demand 57 → 54%, exchange rate 72 → 64%, inflation 69 → 64%) without moving the project ones: this is the reading Step 6 refers to portfolio stress testing when a contract's tail is not independent.
Every register row with an allocation other than "transferred" points to an article; the list is written with the clauses Chilean hospital tender documents use for the same risk, cited from the 2009 hospital programme's contract and from the 2019 standard tender documents (box 4.9a), as a template of what the example hospital would have to write:
| Risk | Allocation | Clause that writes it (Step 8 family) | Where it lives in Chilean hospital tender documents | Goes to the fiscal register |
|---|---|---|---|---|
| Design | mostly transferred | The partner's final design; programme changes through a priced, timed variation | Development of the final project (2009: 1.9.1); works modifications (Concessions Law, art. 19) | no |
| Land, permits and soil | shared | Public site identified in the concession area; geotechnical baseline; permits with a deadline | Concession area (2009: 2.2 and documents nos. 8 and 9; no article with its own site‑handover deadline was found); geotechnical baseline: Puente Industrial 2013, 1.12.9, as a model | no |
| Works cost overrun | fully transferred | Works "entirely at the risk" of the partner; bid price; performance bonds | 2009: 2.5.13; 2019 standard documents: 2.5.11 | no |
| Commissioning and integration | fully transferred | Provisional commissioning with a date and a fine | Fines (2009: 1.8.5.1) | no |
| Building‑management services | mostly transferred | Deduction regime by indicator; service‑level mechanism | Service level determination mechanism (2009: document no. 12, the RS term in the 1.12.3.3 formula) | no |
| Maintenance and deductions | fully transferred | Unavailability deduction with a rectification period | Same; fines (1.8.5.1) | no |
| Life cycle and replacement | fully transferred | Reserve account; scheduled replacement; handback condition | New investments at the partner's cost (2009: 1.12.5) | no |
| Regulatory change | mostly retained | Specific change in law compensated; general with a threshold; change in technical standard: which version governs | Concessions Law, art. 19 (act of authority); Technical Panel D04‑2019‑15 (raised standard: compensable against proof) and D15‑2020‑17 (design risk: not compensable) as the ex post reading | yes, if it compensates |
| Clinical demand | fully retained | Variable per‑bed‑day subsidy over the table; over‑demand compensation | 2009: 1.12.3.3 (variable payment of 0.5 UF per additional bed‑day over table no. 5) and 1.12.4 (30 UTM per day above 110% of design capacity: 413 and 430 beds) | yes: a row with a clause |
| Renegotiation | fully retained | General closing rule: no compensation for events affecting profitability; supplementary agreements | 2009: 1.12.13, financial‑risk distribution option on extinction for serious default (the only "distributed" row named as such in 2009); Itata 2023: 1.13.3 (general rule) | yes, extinction |
| Force majeure (not applicable in the register) | retained by the partner with insurance | Catastrophe insurance; suspension; the State does not contribute to repair | 2009: 1.8.11 and 1.11.1; Itata: 1.17 and 1.7.6.4.2; Regulations, art. 36 | no, and it is a silence |
The hospital's list of silences. The rows left with the State with no article saying so, with probability and impact and no money:
The Risk Platform's checks on the hospital scenario return three findings, all of them the "error" (figure 5.12): two for construction — a critical fiscal rating and catalogue rows "construction" and "design" allocated to the private party — and one for operation — a high rating and the "operation" row allocated to the private party. No warning for an incomplete assessment (all eleven categories are rated), none for register rows with no catalogue category, none for a high risk with no residual rating, none for mitigation with no owner.
The three errors are correct and call for no change, and it is worth saying why. The check cross‑references the fiscal reading with the allocation: if what would happen to the State is critical and the risk sits with the partner, it asks with what backing. In the hospital the answer exists — fixed price, performance bonds, deduction regime — but the check cannot see it because the guarantee is not a scenario field: it is text in the justification. The method's reading is Step 7's: a high or critical transfer to the partner is a row lenders will hand back with a guarantee if the bankability ceiling does not support it, and the check is the reminder to write the guarantee down or to confirm the bond exists. What the check does not do, the manual notes: it does not compare the register with the fiscal reading (demand "high" on the register and "low relevance" on the fiscal side pass with no flag), it does not see the owner as an entity, and it does not read the percentage matrix of the split — only the scenario's party.
The dashboard aggregates the register by status, residual severity and category, and raises high‑residual alerts (figure 5.14): five open rows and five in monitoring; by residual severity — the impact after mitigation — four low, five medium and one high; one alert, clinical demand, with the note "elevated residual risk after mitigation." This is Step 4's correct reading: the only row that did not drop is the one that is not mitigated but paid for, and the dashboard keeps it in view until the fiscal register picks it up.
The handoff to the cost of capital. The Risk Platform hands the cost‑of‑capital module the fraction of each risk the partner retains — 0% in public rows, 50% in shared ones, 100% in private ones — split by each row's fiscal category into systematic (tilts the beta) and specific (additive premium) (figure 5.1, the "Send to" button). For the hospital: fraction retained by the partner 65% in a simple average of the ten rows; systematic fraction 0% — the split's three systematic rows (change in law, demand, renegotiation as adverse government action) are the three public ones — so the beta tilt is the minimum (0.75 = 0.75 + 0.5 × 0); specific fraction 92.9% — the seven construction and operation rows, six private and one shared — and an idiosyncratic premium of 1.39% (1.5% × fraction). The legacy 4% × retained‑fraction premium, 2.60%, is printed as a reference and not used. The reading: the hospital's partner bears specific risk and almost no systematic risk, which is exactly what an availability contract should produce and what the low end of the PPP spread in the comparator (0.90%) assumes.
The other handoffs. To the comparator, the Risk Platform today hands over an indication — 0.30 of rows retained, 0.70 transferred or shared — and not the row‑by‑row register: Step 2's matrix has to be reloaded into the comparator's risk allocation screen (figure 5.16), and the manual declares this as a limit. To the fiscal register, the row with a clause — clinical demand with its variable subsidy — is rated again in the contract matrix (figure 5.17, the Fiscal Commitments manual's figure is reused) and the guarantee is written into its tab; there is no bridge between the two modules, a declared limitation. To the tender, the evaluation criteria weighted by the matrix. And the five‑tab book — summary, register, fiscal matrix, allocation and monitoring — with the session exportable in interchange format (figure 5.15) is the version of the matrix that goes into the file: every figure in this section carries the version of the demonstration scenario that produced it.
The Chilean hospital‑concession programme wrote, in 2009, for the Maipú and La Florida hospitals, the allocation this example reconstructs, and wrote it in the older generation's form: works "entirely at the risk of the Concession Company" (art. 2.5.13), including utility relocations; the variable operating subsidy per bed‑day — a payment of 0.5 UF for each actual bed‑day above the contract's table, plus the service‑level mechanism's service result (art. 1.12.3.3 and document no. 12) — and over‑demand compensation of 30 UTM per day when occupancy exceeds 110% of design capacity, 413 beds in Maipú and 430 in La Florida (art. 1.12.4): clinical demand retained by the State with a clause, which is what turns row 9 into a valuable contingent liability; fines for breach (art. 1.8.5.1) as the performance regime; catastrophe insurance (art. 1.8.11) and suspension with no Treasury contribution (art. 1.11.1) as force majeure; new investments with their environmental assessment at the partner's cost (art. 1.12.5); and the only row 2009 called "distributed" by name: the financial‑risk distribution option on extinction for serious default (art. 1.12.13), the fixed construction subsidy guaranteed against the re‑tender proceeds — §2.6's bankability ceiling, written ten years before the theory.
The standard tender documents for the second healthcare‑facilities programme (DGC Resolution no. 14, of 2019) keep "entirely at risk" (art. 2.5.11) and inherit the financial option (art. 1.12.10), and add what this manual calls the second generation: risk distribution for coverage of additional environmental‑measure costs during construction, in three bands with amounts and a percentage in the supplementary annex, with two university studies and the Technical Panel if there is no agreement (art. 1.12.11). This is the Step 2 "shared with a rule" row written into a hospital contract, and it is what box 4.9c values.
The Coastal Highway's matrix in the fiscal register has ten rows, and this manual reads them in the two lists Step 8 produces. With a payment clause, and therefore valued by the Fiscal Commitments manual over their distribution: the minimum revenue guarantee (80% of first‑year toll revenue, indexed; expected 68.0 over the contract's life with the floor, against 226.9 for total revenue with no floor treated as volatile, and 0 for the availability payment treated as certain — the Payment Mechanisms manual's three readings), the guarantee on 50% of senior debt (expected 26.4) and termination compensation at book value (24.5), mutually exclusive with the previous one; contractual maximum 425.4. With no clause, and therefore in the matrix with probability and impact and no money: five rows this manual's engine rates with the same PFRAM rule the Risk Platform uses (figure 5.17):
PFRAM category Contract risk P × I Rating Mitigated Priority The same cell on the five‑level grid Change in law Tax or environmental regime raising operating cost low × high medium yes (clause with a threshold) monitor 8 · medium Financial rebalancing Rebalancing for a traffic drop not covered by the guarantee medium × medium medium no monitor 9 · medium Renegotiation Works expansion in exchange for time or payments high × medium high no plan mitigation 12 · high Force majeure A natural event on the coast with insufficient insurance low × high medium yes (mandatory insurance) monitor 8 · medium Termination Implicit bailout if the company cannot refinance low × high medium no monitor 8 · medium What the page teaches: the minimum revenue guarantee is the matrix's demand row, retaining the low tail at a price — the frontier puts it at 57% retained and the Coastal Highway shares it by band; the debt guarantee is the financial row retained above the bankability ceiling; and renegotiation — the highest of the five clauseless rows, the only one with a "plan" priority — is the one none of the three guarantees covers. This manual identifies and rates it; that one registers it alongside the commitment; neither values it, and both say so. The fiscal register screen's priorities use a different vocabulary from the Risk Platform's (low / medium / high versus accept / monitor / plan mitigation); the manual publishes the engine rule's and notes the difference (§5).
The tender documents for the Acceso Norte a Concepción Concession (2023) write the "additional environmental measures from the qualification ruling during construction" row with a three‑band sharing rule and no option (art. 1.13.3.2): the concessionaire "entirely at its own charge" up to UF 236,000 — reinvesting the difference if it spends less; the next band of UF 100,000 reimbursed by the MOP at 50%; and the excess above UF 336,000 reimbursed in full by the MOP, with two university studies and the Technical Panel if there is no agreement. It is "shared with a rule" in its contractual form: a deductible, a shared band and a cap on the concessionaire. What the tender documents do not bring is the valuation: the amounts come from each set of tender documents' own negotiation and not from a published distribution (§2.5), which is why Step 6 supplies one.
With a declared, illustrative distribution of the environmental cost overrun — triangular UF 60,000 / 250,000 / 900,000, probability of occurrence 0.6, N 10,000, seed 42, drawn with the same sampler as the tail layer — and the article's rule applied draw by draw:
UF Mean Median P95 CVaR95 P99 Maximum Total cost overrun 240,256 216,972 690,999 763,031 807,699 887,342 Concessionaire (deductible + 50% of the shared band) 154,370 216,972 286,000 286,000 286,000 286,000 MOP (50% of the shared band + excess) 85,886 0 404,999 477,031 521,699 601,342 The cost overrun occurs in 60% of draws, enters the shared band in 47% and the MOP's band in 34%. In expectation the MOP retains 36% of the cost overrun; at the P95 it retains UF 405,000 — 59% of the outcome — and the concessionaire is capped at UF 286,000 for everything above the median. That is the rule's shape: the deductible and the shared band leave the concessionaire the part of the risk it manages — the low and medium tail, where its diligence on the environmental ruling changes the outcome — and give the MOP the high tail, where no one manages anything and the sovereign absorbs it more cheaply (§2.6). Two counterpoints on the same distribution: under "entirely at risk" (2009) the MOP retains zero and the concessionaire's P95 is UF 691,000 — the figure the lender hands back as a guarantee; under a "50% shared" rule with no deductible, the MOP's P95 would be UF 345,000, lower than with the bands, because the uncapped 50% also spreads the low tail the concessionaire should have carried. And with the 2013 deductible (Puente Industrial, art. 1.12.8: UF 30,000 with the excess deducted from the present value of revenue), the MOP would bear UF 222,000 on average and UF 661,000 at the P95: the newer generation did not just name the risk; in ten years it multiplied the concessionaire's deductible eightfold. Illustrative figures, not the contract's: what belongs to the contract is the rule, and what the manual adds is that a banded rule with no declared distribution is an allocation with no figure, and Step 6 is where one is put on it.
The PPP unit has a ten‑row matrix allocated with justification, three public, six private and one shared; both named scales, with the works cost overrun first on both and clinical demand as the only residual high; a premium of 117.05 under a ceiling of 126.15, of which it retains 12.59 and transfers 104.46, plus 13.67 of renegotiation; a retained book of 26.3 in expectation and 53.5 at the P95; a frontier test that confirms the project allocation, puts regulatory change at the ceiling and shows that transferring demand would destroy value; eleven clauses with their reference article and five silences. With that, the reasonable decision is to take the matrix to the tender documents with three conditions: write the land row's sharing rule (a geotechnical baseline, not the word "shared"); write the general change‑in‑law threshold and which version of the technical standard governs; and write the variable per‑bed‑day subsidy and over‑demand compensation as what they are, a row with a clause that goes to the fiscal register.
The finance ministry has the same matrix read by fiscal category — one critical and two high, all mitigated except renegotiation — a retained book whose mean enters the comparator and whose tail (53.5 at the P95, 59.4 in expected shortfall) is compared with its reserve, and a list of silences in which force majeure above the insurance and the implicit guarantee have no figure. Its decision follows the partition rule: admit the retention of clinical demand and of regulatory change, require the guarantee — bonds, reserve account — that backs the critical transfers the check flagged, and ask that the five silences enter the contract's fiscal‑risk matrix with probability and impact, no money, and a date.
The script prints every figure in this section and in section 6 in a single document, with the repository version, the seed and N in the header. It runs on the same engines the screens use and writes nothing to the platform. In order:
Name correspondence (demonstration scenario → manual): Design changes and scope creep → Design (medical programme and standards); Land, permits and soil conditions → Land, permits and soil; Construction cost and schedule overrun → Works cost overrun; Commissioning and medical‑equipment integration → Commissioning and equipment integration; Building‑management (FM) services cost overrun → Building‑management services cost; Maintenance / availability‑deduction risk → Maintenance and availability deductions; Lifecycle / equipment replacement → Life cycle and equipment replacement; Regulatory / clinical‑standards change → Regulatory and clinical‑standards change; Clinical demand / bed‑occupancy risk → Clinical demand / bed occupancy; Renegotiation risk → Renegotiation.
The method in §3 can be run with any spreadsheet, any model and any register. This section describes how Austral's Risk Platform runs it — the module where risk is identified from the sector catalogue, allocated with a justification, rated on both scales, its mitigation planned, its consistency checked and it is monitored, with a quantitative tail layer and the retention frontier as an engine — and how the same register flows into the two screens of other modules where risk turns into money: the comparator's risk allocation (Value for Money manual), where retained risk becomes a premium, and the contract risk matrix in the fiscal register (Fiscal Commitments manual), where risk with no clause is recorded next to the commitment. For each screen: which step it runs, what it asks for, what it delivers, what the analyst decides and where the limit is. The screenshots are from the guest workspace and from §4's hospital — never client data — and are numbered in the order of the walkthrough, not of the menu. Everything below exists today; where a capability is not implemented, it is said, and where a screen and the engine do not say the same thing, that is said too. The section is useful, not promotional: every screenshot is mapped to a §3 step and table 5.12 collects them. The screenshots are taken on the production version from 5.1's version note; until then they appear as placeholders with a caption and figures between ⟨…⟩.
The Risk Platform lives at platform.austral-intelligence.com/workspaces/<workspace>/risk, and every screen is a route under that address (…/risk/allocation, …/risk/var-overlay): a scenario is shared by sending a link. No registration is needed to try it: on entering the platform, a guest workspace is created with its own database, and that workspace — with everything loaded into it — is kept if it is later converted into an account. A guest can build the register, allocate, rate, mitigate, run the checks and read the monitoring; three things require an account, as everywhere on the platform: downloads (the Excel workbook, the session), the VaR / CVaR layer and the retention‑frontier calls, which are paid compute.
The module's home screen summarises the state in four figures — risk scenarios, register rows, high or critical risks, and the engine's label ("GIH + PFRAM + APMG": the sector catalogue, the fiscal taxonomy and the operational grid) — a tile grid with fifteen views, the recent scenarios with each one's Send to button (cost of capital, procurement, comparator: the 5.8 handoffs), the Excel workbook download and, at the bottom, the workspace data card with the two demonstration packs. Three points of form. First: the tile grid links to fifteen views and leaves out three — project configuration (Step 0's profile), the allocation summary and analytics — reached through the platform's sidebar or by typing the route; this is declared and not fixed. Second: the module's interface has been in Spanish since the September 2026 release, and the manual always uses its own English vocabulary with the screen's Spanish label in parentheses the first time; the demonstration pack's data — the hospital's ten row names and their justifications — is in English, because it is data and not interface, and the screenshots show it that way: annex 4.A gives the name correspondence and the text writes them in English. Third: the module ships its own online manual page, with the fifteen functions and an example; this manual is its extended version, not its replacement.
The demonstration packs. The platform ships two for this module, both loaded from the workspace data card on the home screen: the default pack ("Tres escenarios de riesgo APP", "Three PPP risk scenarios"), with three generic scenarios — a toll highway in West Africa, a teaching hospital in East Africa and a solar plant in northern Chile — each with its matrix, its fiscal assessment and its register; and the "hospital" pack ("APP de Hospital Regional", "Regional Hospital PPP"), which is the 300‑bed hospital from the Value for Money and Eligibility manuals with its ten risks, its allocation, its fiscal reading and its register (§4). Loading the default pack first deletes any risk scenarios there were; loading the "hospital" pack deletes nothing: it creates or updates its one scenario and leaves the others. The header's demo button loads only the default pack; a reader who wants to reproduce §4 on screen loads the "hospital" pack from the card — or through the API (5.9) — and, for the whole‑workspace screens' figures to match §4's, does it in a new guest workspace, with no default pack loaded (5.10).
Version note. This section describes the platform as it stands after three successive September 2026 releases, all in production as this version of the manual closes (20 September 2026). The first brought the Spanish‑language screens (every screenshot); the single per‑scenario register that monitoring, the checks, the Excel workbook, the tail layer and the handoffs read (C9, C11, C12, C13, C14); the catalogue → PFRAM correspondence in the cost‑of‑capital handoff (5.8); the "hospital" pack (every hospital screenshot); and seed 42 printed in the tail layer (C12). The second, written from the findings of the first reading of this section, fixed the allocation summary, which showed zero allocated rows for every scenario (C5); gave the Register screen both ratings — before and after mitigation — and the sector catalogue category instead of six of its own labels (C9); added the allocation sheet to the Excel workbook (C14); and put the "hospital" pack's label on the workspace data card (C1). The third, after this section's sixteen screenshots were taken, fixed four further findings: the AI texts in Reports now receive the scenario's matrix, register and fiscal reading instead of an empty context (C14); the 5 × 5 Matrix now preloads from the scenario's register instead of opening with three factory rows unrelated to the pack (C10); the Register screen's counters now use the same bands as the engine (1–4/5–9/10–16/20–25) instead of their own band (C9); and the Excel workbook is now labelled in the session's language (C14). Screenshots C10 and C14 predate this third release and will be retaken for the manual's next version; the section's other figures do not change with it. Still declared as limits, and not fixed: the matrix, the register and the tail preload are saved against the most recent scenario with no selector; monitoring, the fiscal summary, analytics and the home screen are workspace‑wide; the interchange session has no screen; and procurement receives equal weights (5.10). A reader who opens the platform on an earlier version will see English‑language screens, a register monitoring does not read, an allocation summary at zero and a tail that changes on every run; §4 was written on this same version's engines and its figures do not change.
Figure 5.1 — Risk Platform home with the "hospital" pack loaded: 1 scenario, 10 register rows, 1 high‑or‑critical residual risk, the engine's label; the fifteen‑tile grid; the hospital in recent scenarios with its "Send to" button expanded — Cost of Equity, Procurement evaluation, Value for Money (cost of capital, procurement, comparator); at the bottom, the workspace data card. (§1; Step 9.) [note: the four figures are workspace‑wide; with the default pack also loaded, they would read 4 scenarios and the sum of all four registers. The three "Send to" destinations print in English even though the rest of the screen is in Spanish. The workspace data card is a single‑pack‑at‑a‑time selector, not two cards side by side: the "hospital" pack is the same dropdown's second option, not a second card visible next to the default pack's.]
Label: Configuración del proyecto ("Project configuration"; …/risk/project-setup). Input: Step 0's profile in sixteen fields: name, country, catalogue sector (the Global Infrastructure Hub's eighteen, in a list), cycle stage, description, estimated investment, works investment, annual operating cost, contract term, construction period, payment mechanism, revenue model, government support, market maturity, legal system, country income level. Output: the saved risk scenario, the module's unit of work: the allocation matrix, the fiscal reading and the register hang off it, and the checks, the Excel workbook and the handoffs read it by name. Below, the list of existing scenarios with their expandable profile. Analyst's decision: the sector — which fixes the starting catalogue the allocation matrix will load — and the payment mechanism, which fixes in advance the destination of demand (Step 2). Limit: the profile has no field for a declared taxonomy or for Step 0's catalogue → PFRAM correspondence table: the correspondence lives in the engine (it is what the cost‑of‑capital handoff and the checks use, 5.4) and is neither shown nor edited on this screen; and there is no version field for the matrix (Step 9): the version is the scenario, and the manual's practice is to save one scenario per version ("hospital — approval," "hospital — tender documents") and export the session (C14) at every milestone.

Figure 5.2 — Project configuration, "Existentes" ("Existing") tab, with the hospital's profile: hospital sector, country Chile, stage Appraisal, estimated value and CapEx 150, 20‑year duration. (Step 0.) [note: the screen does not reproduce the full caption — an existing project's card shows only sector, country, stage, description (in English, from the demonstration pack), estimated value, CapEx and duration; it does not display the construction period, the payment mechanism, the revenue model, government support, market maturity or the legal system, which do exist in the saved profile (5.9) but not in this list view — they are only visible when editing. The six fields missing on screen (3 years of works, by availability, government payments with a base of 36.0/year +2%/year, none, developing, civil law) are taken from the hospital_m1 pack, not from this screenshot.]
Label: Matriz de asignación ("Allocation matrix"; …/risk/allocation). Input: the screen opens with a default matrix of six families — construction, operation, revenue, financial, force majeure, other — and 23 risks with preloaded percentages; the load sector defaults button replaces it with the sector catalogue chosen (eighteen sectors): the catalogue's categories with their sub‑risks, each with the typical allocation translated into percentages and with the catalogue's rationale as an initial justification. Per sub‑risk, three percentages — Public / Private / Shared, which must sum to 100 — with the bar, and the editable justification. Output: on save, the allocation in two forms: the rows with percentages and justification (to redraw the screen) and the row → party map the handoffs, the checks, the home screen and the session read, under the majority‑share rule (a tie or a shared majority → shared). Above, the workspace averages (public, private, shared) and the chart. Analyst's decision: all of Step 2, row by row: confirm or refute the catalogue's typical allocation with the three questions, adjust the percentages, and write the justification that answers them; and, for shared rows, the sharing rule, which the screen has no field for and is written into the justification ("UF 236,000 deductible; UF 100,000 band at 50%; excess to the State"). Limit: four, declared. (i) The default matrix is a third vocabulary — neither the sector catalogue nor PFRAM — and the manual does not adopt it: it teaches with the catalogue loaded. (ii) The screen saves the matrix against the workspace's most recent scenario, with no scenario selector: with the "hospital" pack loaded after the default pack, the hospital is the most recent scenario and the matrix is its; if another scenario is created afterwards, the next matrix will be the new one's. (iii) Rows are saved by name: renaming a row creates another one (Step 0: risks are added, not renamed). (iv) The degree — the 20% retained in design, the 80% in regulatory change — exists in this screen's percentages and in the comparator's register (C15), but the scenario stores only the party, and the demonstration pack rounds intermediate degrees to the majority party: Step 5's figure comes from the comparator, not from here (5.5).

Figure 5.3 — Allocation matrix with the sector's GIH catalogue loaded through the "Cargar valores por defecto del sector GIH" ("Load GIH sector defaults") button (sector "Hospital"): sixteen categories with canonical percentages (Public 36.2% / Private 36.2% / Shared 27.7% on average) and no justification — the vocabulary the manual does not adopt. (Step 2.) [note: the actual screen does not reproduce the caption word for word. §5.2 describes the screen's default matrix as "six families... and 23 risks" — the state a scenario opens in when it has never loaded a sector or the demonstration pack; that screenshot requires a new project with no allocation saved, and the "New project" form from C2 did not finish creating one in this run (double‑check before citing the exact number of families in the platform's own vocabulary). What this figure does show — faithfully, on production — is the "no justification" state after loading a sector's canonical catalogue, which is the point the caption is meant to illustrate: 16 categories, 100% in a single party per sub‑risk, an empty justification field. This load is client‑side only — "Guardar Asignación" ("Save allocation") was never pressed — and was discarded on reloading the page for Screenshot 3b.]
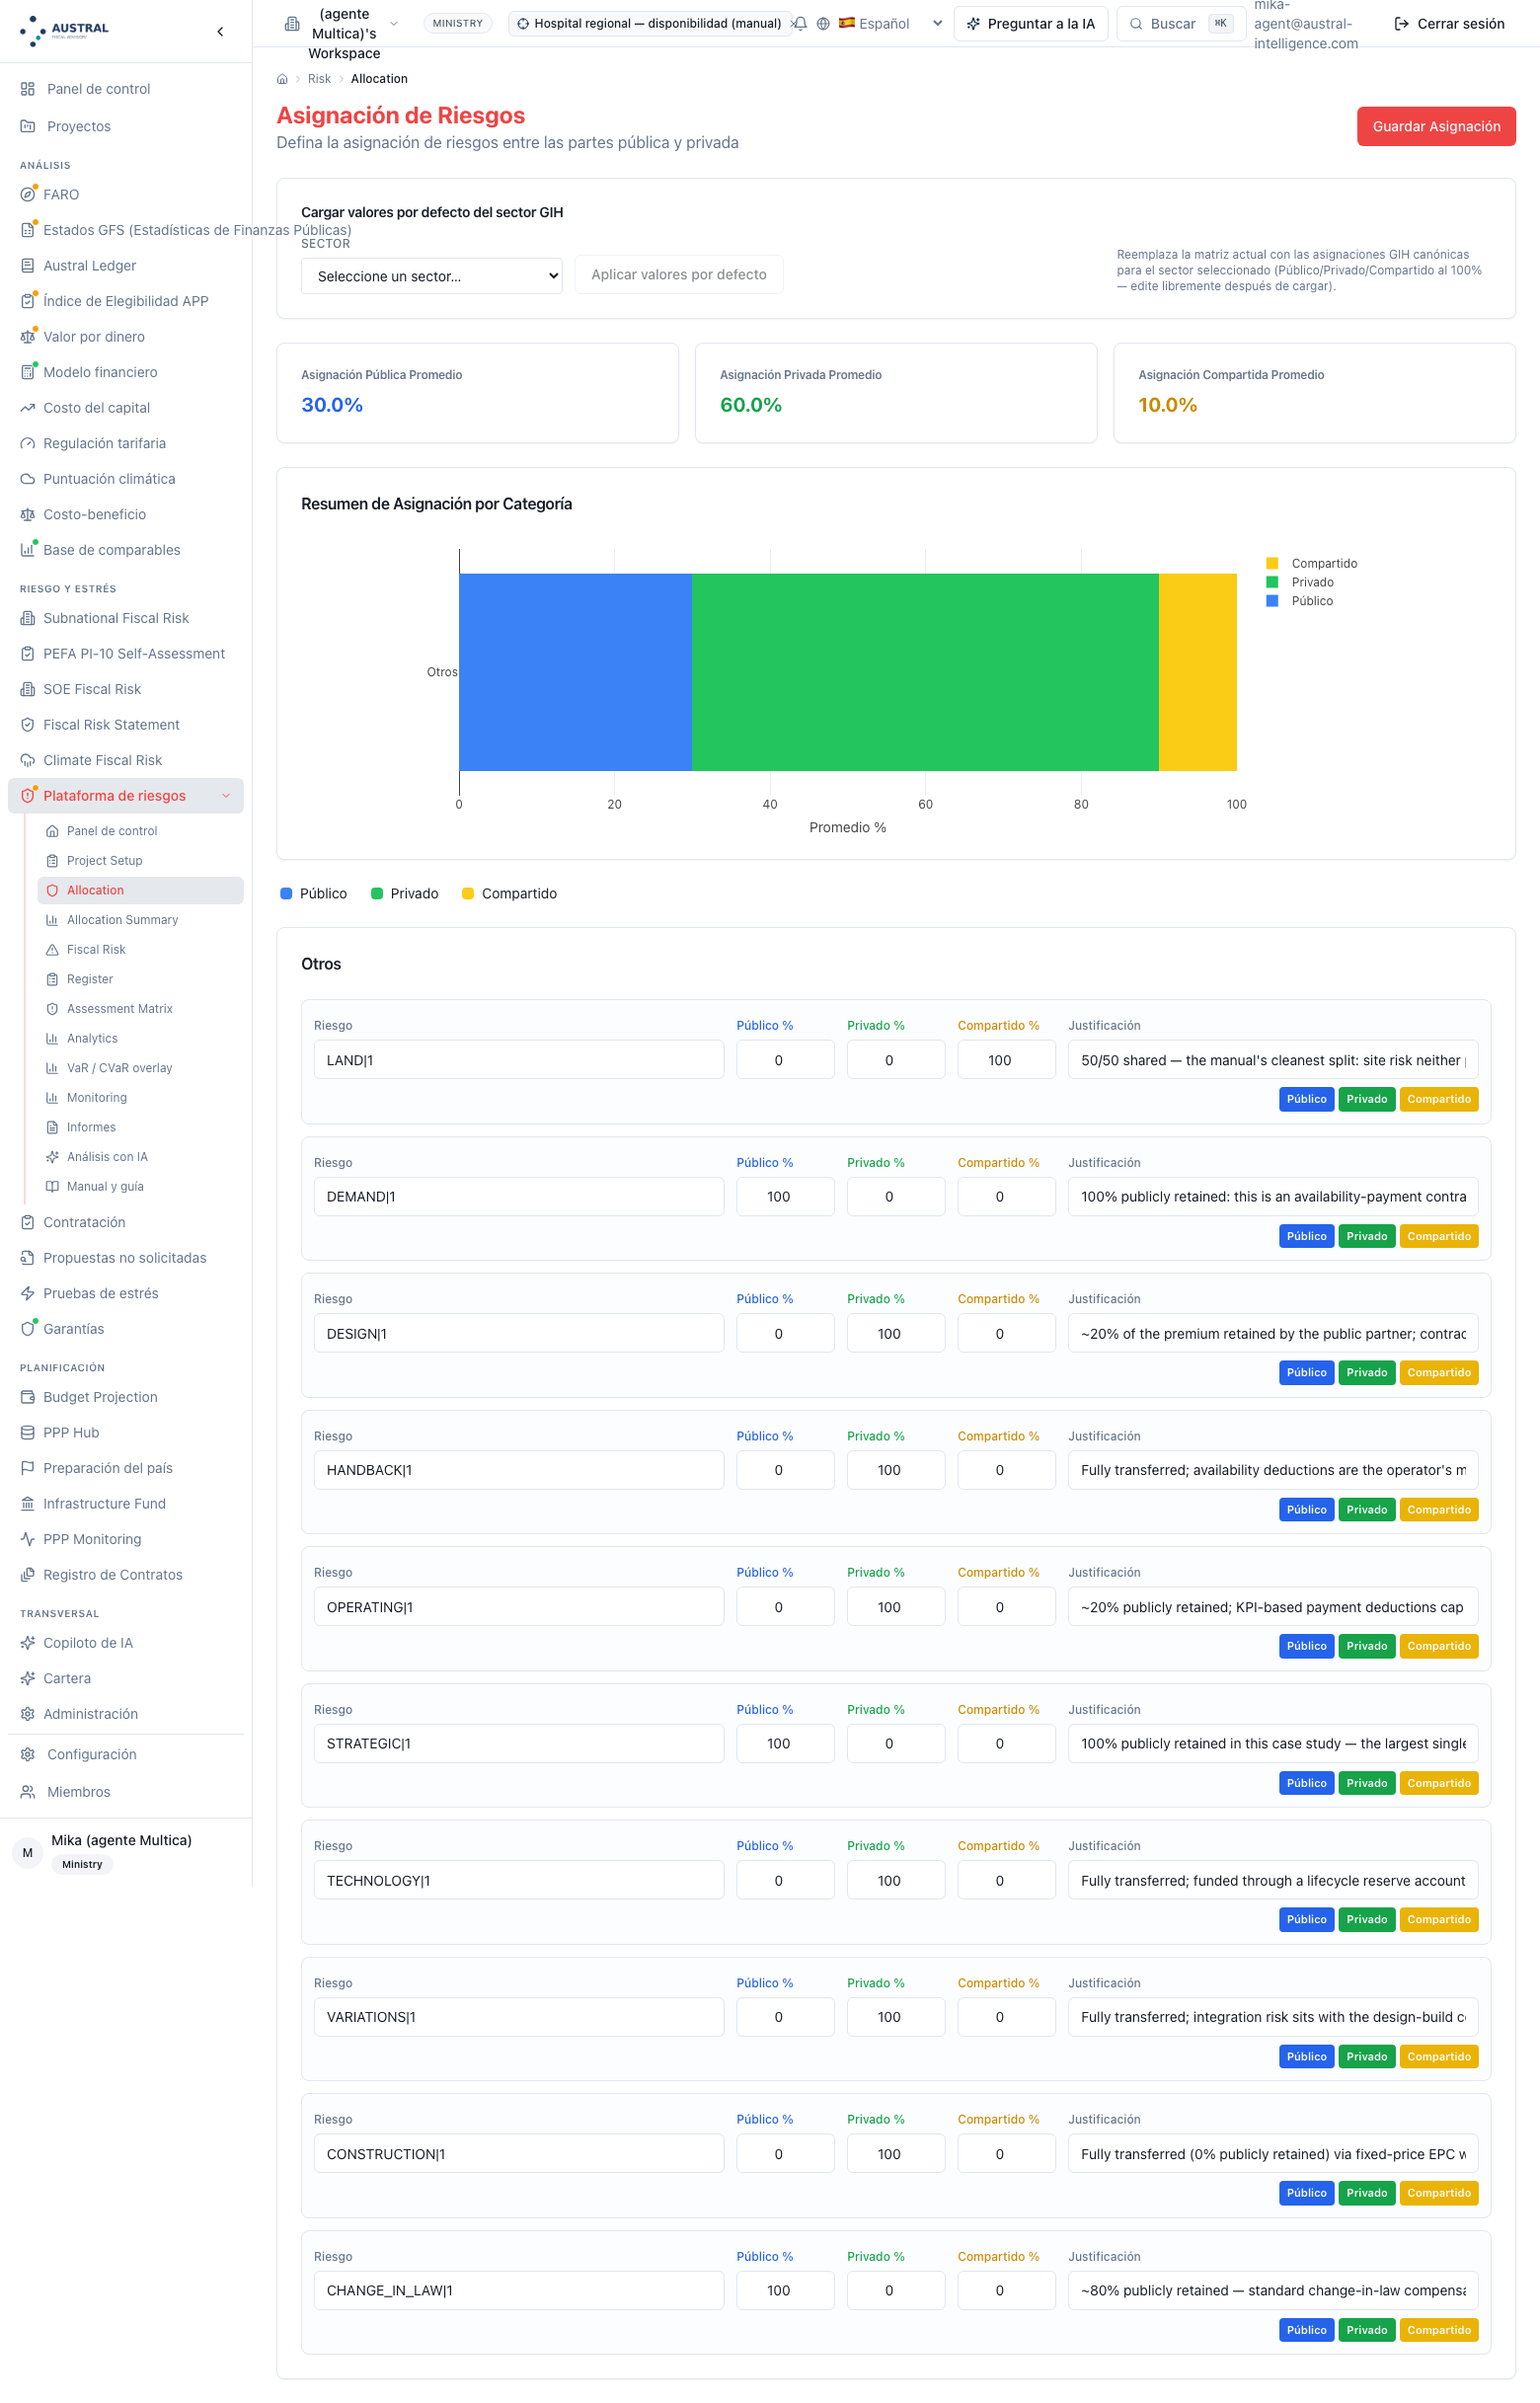
Figure 5.4 — The same screen with the "hospital" catalogue loaded and §4.3's matrix: the ten rows of the valued register, the public / private / shared bar and the per‑row justification (in English in the demonstration pack); workspace averages Public 30.0% / Private 60.0% / Shared 10.0%. (Steps 1–2.)
Label: Comparación intersectorial ("Cross‑sector comparison"; …/risk/cross-sector). Input: two or more catalogue sectors. Output: by catalogue category and sub‑risk, the typical allocation in each sector, the dominant one and whether there is consensus; and the public / private / shared count by sector. Analyst's decision: none that is saved; it is the catalogue page a committee asks for when someone proposes transferring a risk "because highways transfer it": demand is public in the hospital's two rows and shared or private in highways, and the reason — who controls the volume — is Irwin's first question (§4.3). Limit: it compares catalogues, not scenarios: the hospital's allocation against a highway's from the workspace is not compared here but in the allocation summary (C5). Comparison extended across many sectors and many categories does not get its own subsection in the manual.
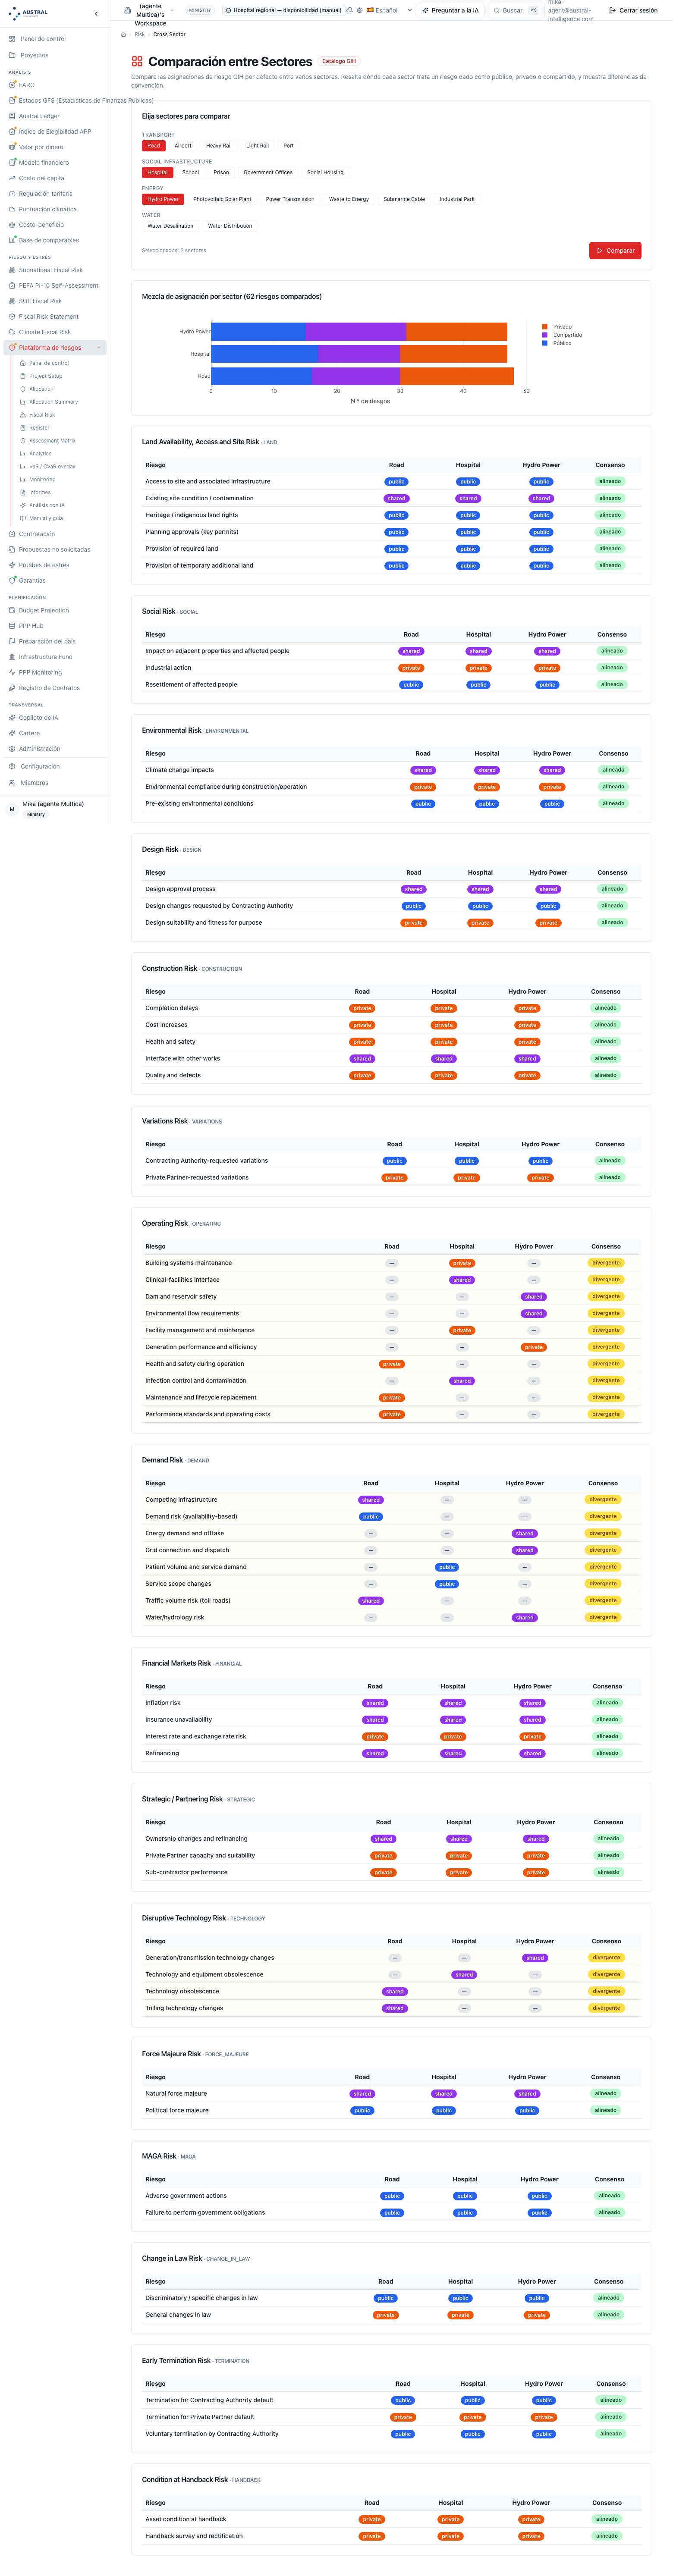
Figure 5.5 — Cross‑sector comparison, "demand" category: hospital, public in both its sub‑risks ("Patient volume and service demand," "Service scope changes"); toll highway, shared in two rows ("Competing infrastructure," "Traffic volume risk") and public in one ("Demand risk, availability‑based"); no consensus on any row. (Step 2.) [note: the original caption said "toll highway: shared / private"; the production screenshot has no highway demand row rated "private" — the highway's three rows relevant to this category are shared or public. The figure is corrected here, the image is not retouched.]
Label: Resumen de asignación ("Allocation summary"; …/risk/allocation-summary). Input: the workspace's scenarios. Output: by scenario and for the workspace, the count and percentage of rows retained, transferred, shared and other. For the hospital, what the saved matrix says: Public 3 · Private 6 · Shared 1. Analyst's decision: reading the matrix's shape before valuing it — an availability contract with most rows with the partner and three with the State is the canonical shape; a highway with demand "public" calls for an explanation. Limit: it counts rows by party and does not read the degree or the justification; and it is workspace‑wide, with the per‑scenario breakdown. Until the second September 2026 release, the screen read the allocation by a key the scenario list did not carry and showed zero allocated rows for every one; the screenshot is from the fixed version.
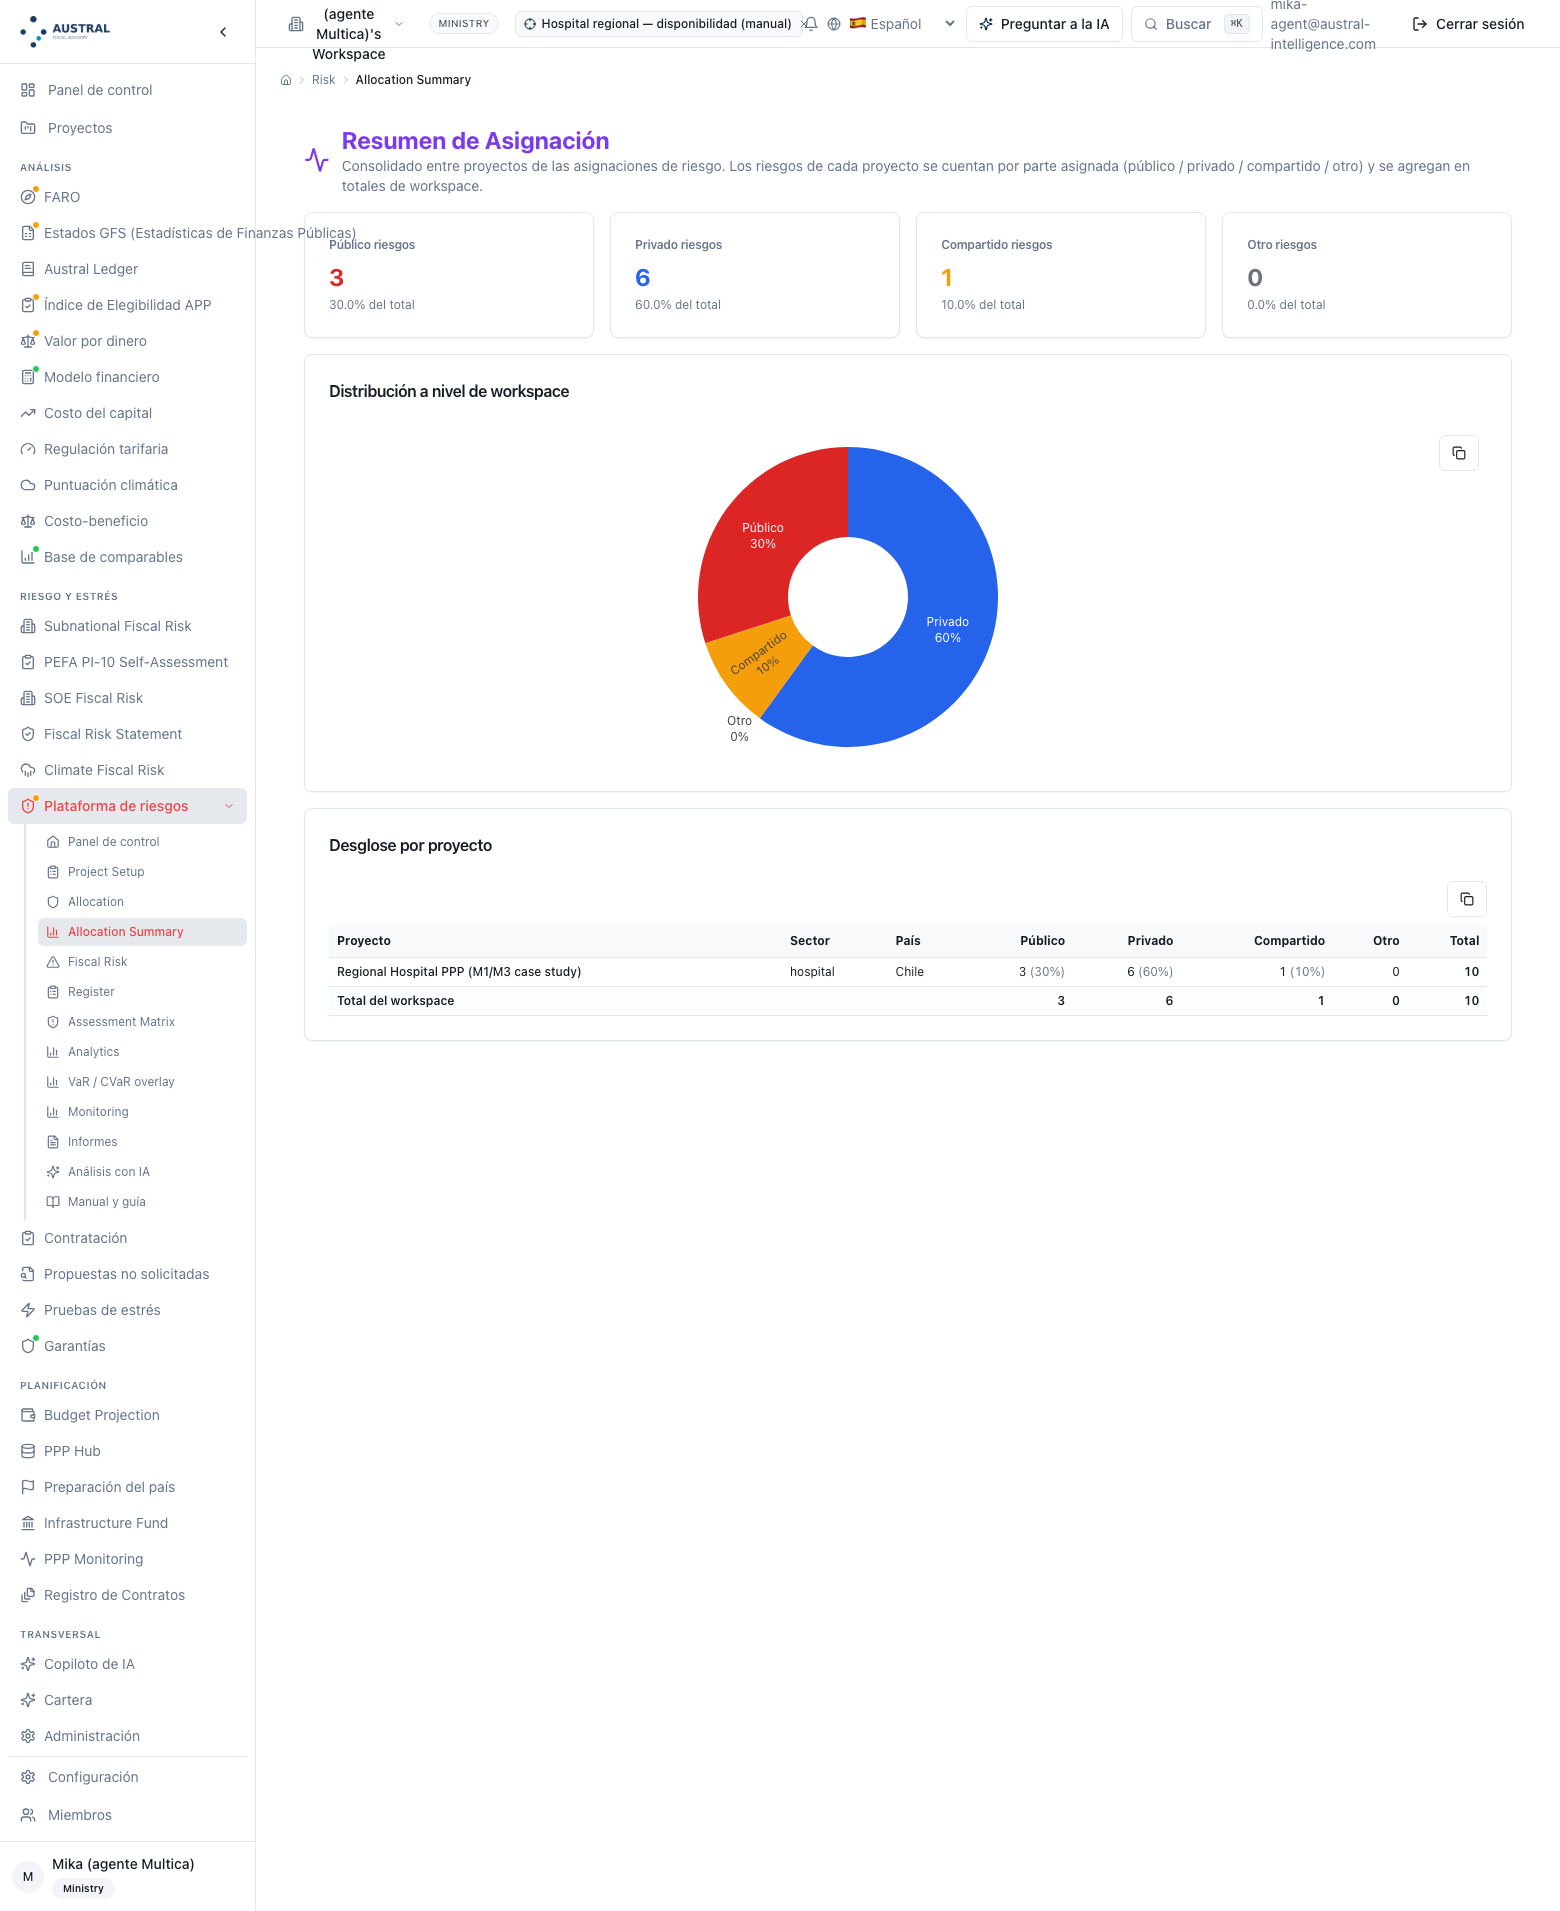
Figure 5.6 — Allocation summary: the hospital with Public 3 (30.0%) · Private 6 (60.0%) · Shared 1 (10.0%) · Other 0, and an identical workspace total (a single scenario). (Step 2.)
Label: Planificación de mitigación ("Mitigation planning"; …/risk/mitigation). Input: the scenario (selector at the top) and, for each of PFRAM's eleven categories, probability and impact on three levels (low, medium, high), mitigation status (yes / no), strategy, responsible entity and notes. Output: per category, the rating (low relevance, low, medium, high, critical) and the priority (accept, monitor, plan mitigation, act urgently) under the engine's rule, which matches PFRAM cell for cell on the rating and differs in one cell on the priority — unmitigated medium: "monitor" here, "high priority" in PFRAM; the method publishes the screen's table with the cell flagged (Step 4) — and saves it to the scenario. For the hospital: construction critical / plan, operation and renegotiation high (renegotiation unmitigated: plan), financial medium, and seven categories low or low‑relevance; a 7 / 1 / 2 / 1 mix (§4.4). Analyst's decision: Step 3 on its fiscal scale — impact on the State, not on the project: demand is low relevance under availability even though the register rates it high — and Step 4 on its fiscal side: whether there is mitigation, which and whose. Limit: the screen is Step 4 by fiscal category, not by register row; the per‑row plan — action, owner, deadline, status — lives in the register (C9), and the verifier exists in neither; this screen's "responsible entity" is the fiscal owner of the category, which the demonstration pack fills with entities (Ministry of Health, finance ministry, contracting authority), while the register stores the owner as a party.
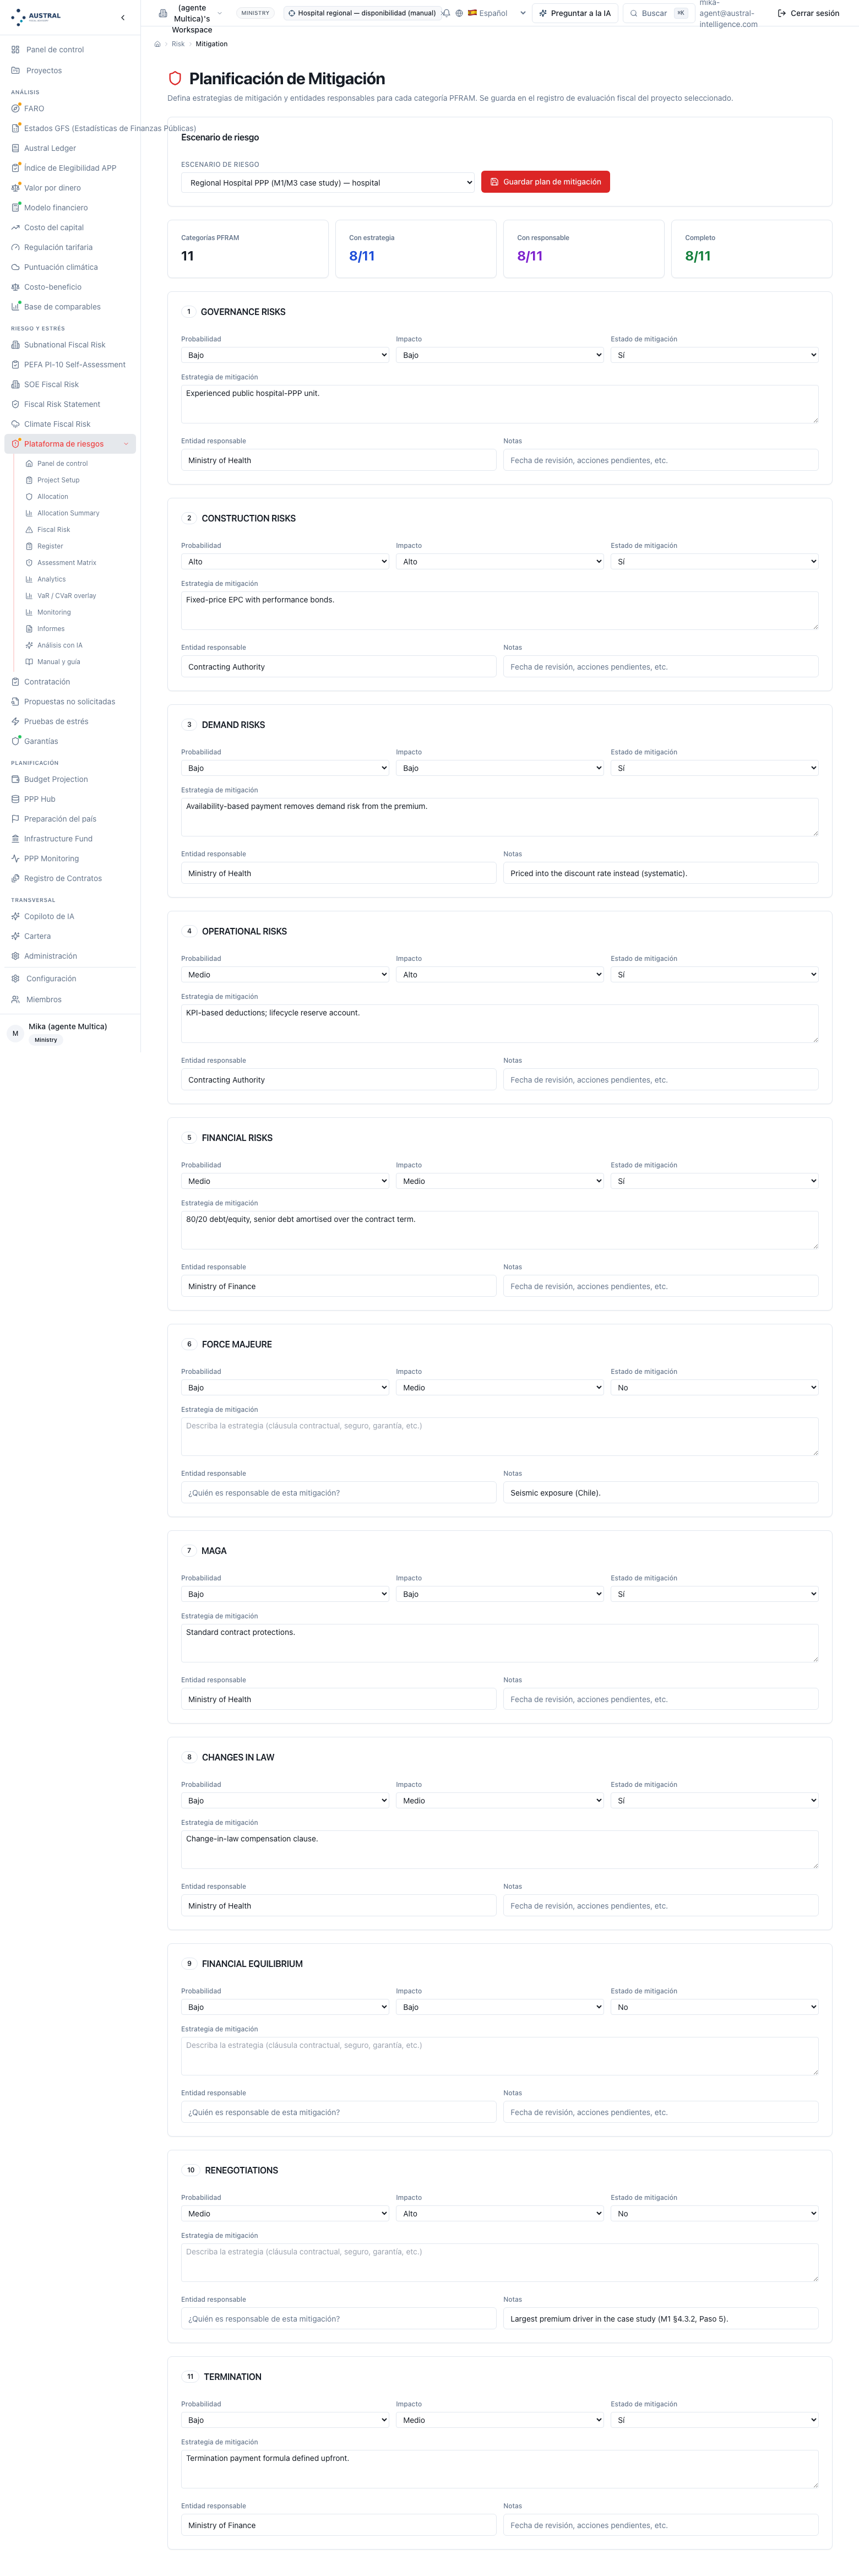
Figure 5.7 — The hospital's mitigation planning: the eleven categories with probability and impact, mitigation status, strategy and responsible party; construction high × high, mitigated ("Fixed‑price EPC with performance bonds," Contracting Authority); renegotiation medium × high, unmitigated ("Largest premium driver in the case study," Ministry of Finance); demand low × low, mitigated ("Availability‑based payment removes demand risk from the premium," Ministry of Health). 8/11 categories with a strategy, 8/11 with a responsible party, 8/11 complete. (Steps 3–4, the 3 × 3 scale.) [note: this screen does not print the rating (critical/high/medium/low relevance) or the priority (plan mitigation/accept/monitor) by category — only the six input fields. The ratings cited in the caption ("critical → plan mitigation," "low relevance → accept") are the Fiscal Summary's (C8) and the Quick Assessment's (C7) over the same probability × impact, not something this screen itself shows. The form requires choosing the scenario in its own selector ("Seleccione un proyecto…," "Select a project…") first; with a single scenario in the workspace, the screen auto‑selects it.]
Label: Riesgo fiscal ("Fiscal risk"; …/risk/fiscal-risk). Input: PFRAM's question bank by category (34 questions across eleven categories, with conditional follow‑up), and a one‑cell quick assessment: probability, impact and mitigation status. Output: that cell's rating and priority, with the framework's name in the response — "PFRAM 3 × 3" — and a note that the register's five‑level grid may place the same entry in a different band. Analyst's decision: using the questions in Step 1 to surface what the sector catalogue does not name (governance, financial rebalancing, renegotiation), and the quick assessment as a calculator for Step 3's rule before writing it into the mitigation plan (C6). Limit: the climate questions ("yes, but not for climate") the bank carries are a platform extension, not PFRAM 2.0's; answers to the bank are not saved to the scenario from this screen — it is a calculator; and the quick assessment does not write to the mitigation plan: the rating is saved from C6.
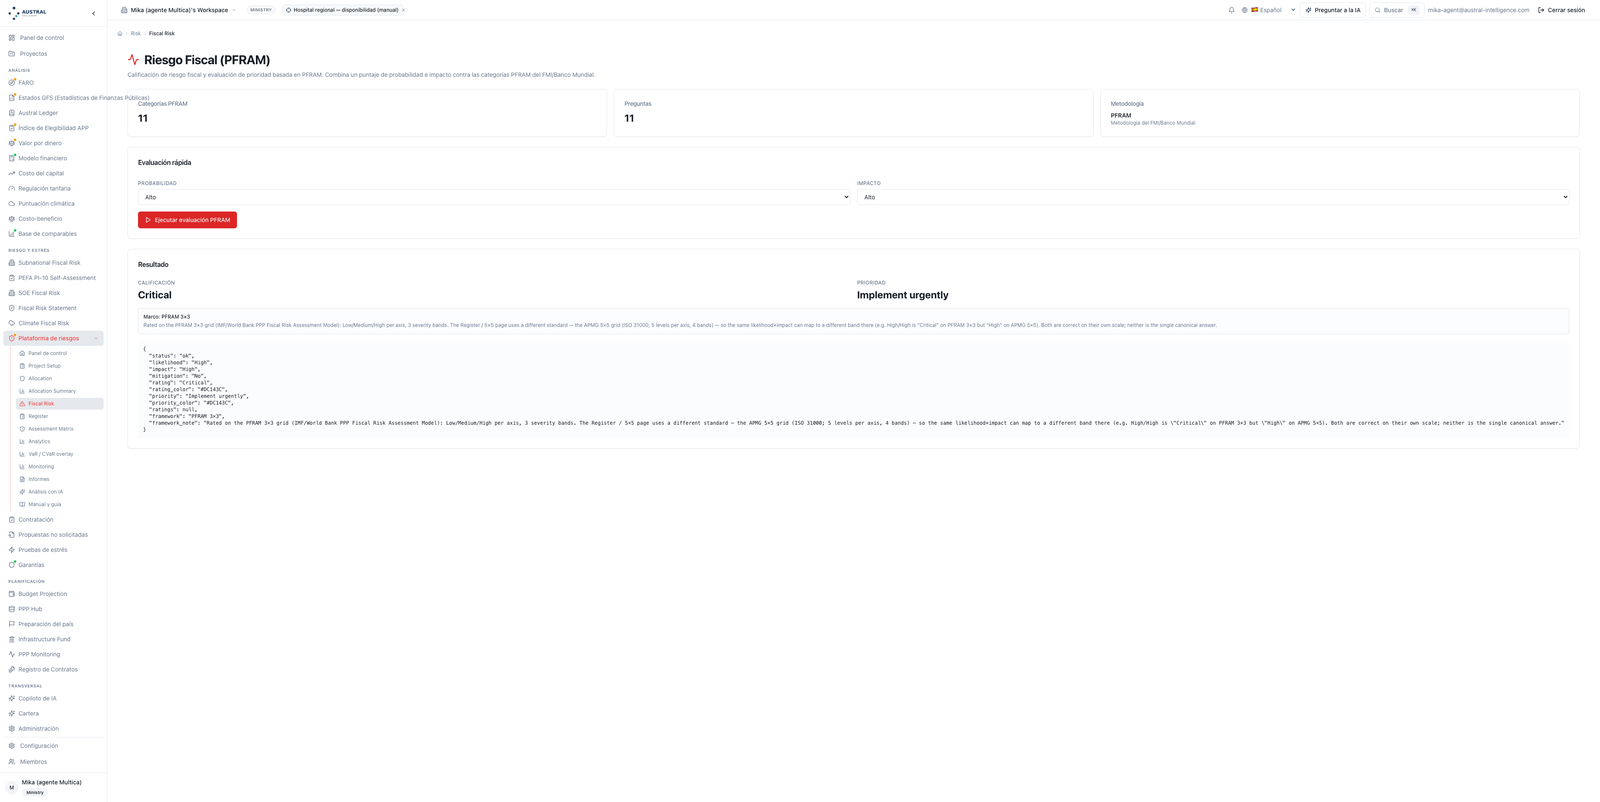
Figure 5.8 — Fiscal risk: quick assessment high × high → rating "Critical," priority "Implement urgently," with the framework's name ("PFRAM 3×3") and the note distinguishing this grid's band from the register's 5×5. (Steps 1 and 3.) [note: the screenshot predates a production fix that now translates the result ("Crítico," "Implementar con urgencia"); the manual uses that translation in the body text. Also, there is no panel with an "expanded question bank under construction": this screen only carries the two header figures (categories 11, questions 11) and the quick‑assessment calculator; there is no per‑category question list on this route.]
Label: Resumen fiscal ("Fiscal summary"; …/risk/fiscal-summary). Input: the fiscal readings of every scenario in the workspace. Output: the 3 × 3 heat map with each cell's categories, the table by category (critical / high / medium / low / not assessed) and by scenario, and a 0–100 score by category and by scenario — the average of the weights critical 100, high 75, medium 50, low 25, low relevance 10, not assessed 0: a screen convention, not PFRAM's — and the alerts. For the hospital: low 7 · medium 1 · high 2 · critical 1 (§4.4). Analyst's decision: none that is saved; it is the finance ministry's reading (§1.3) by category and by contract, and where the portfolio starts to come into view (3.10). Limit: it is workspace‑wide — with the default pack also loaded, the map sums four scenarios — and the 0–100 score is a convention the manual cites and does not use as a figure.
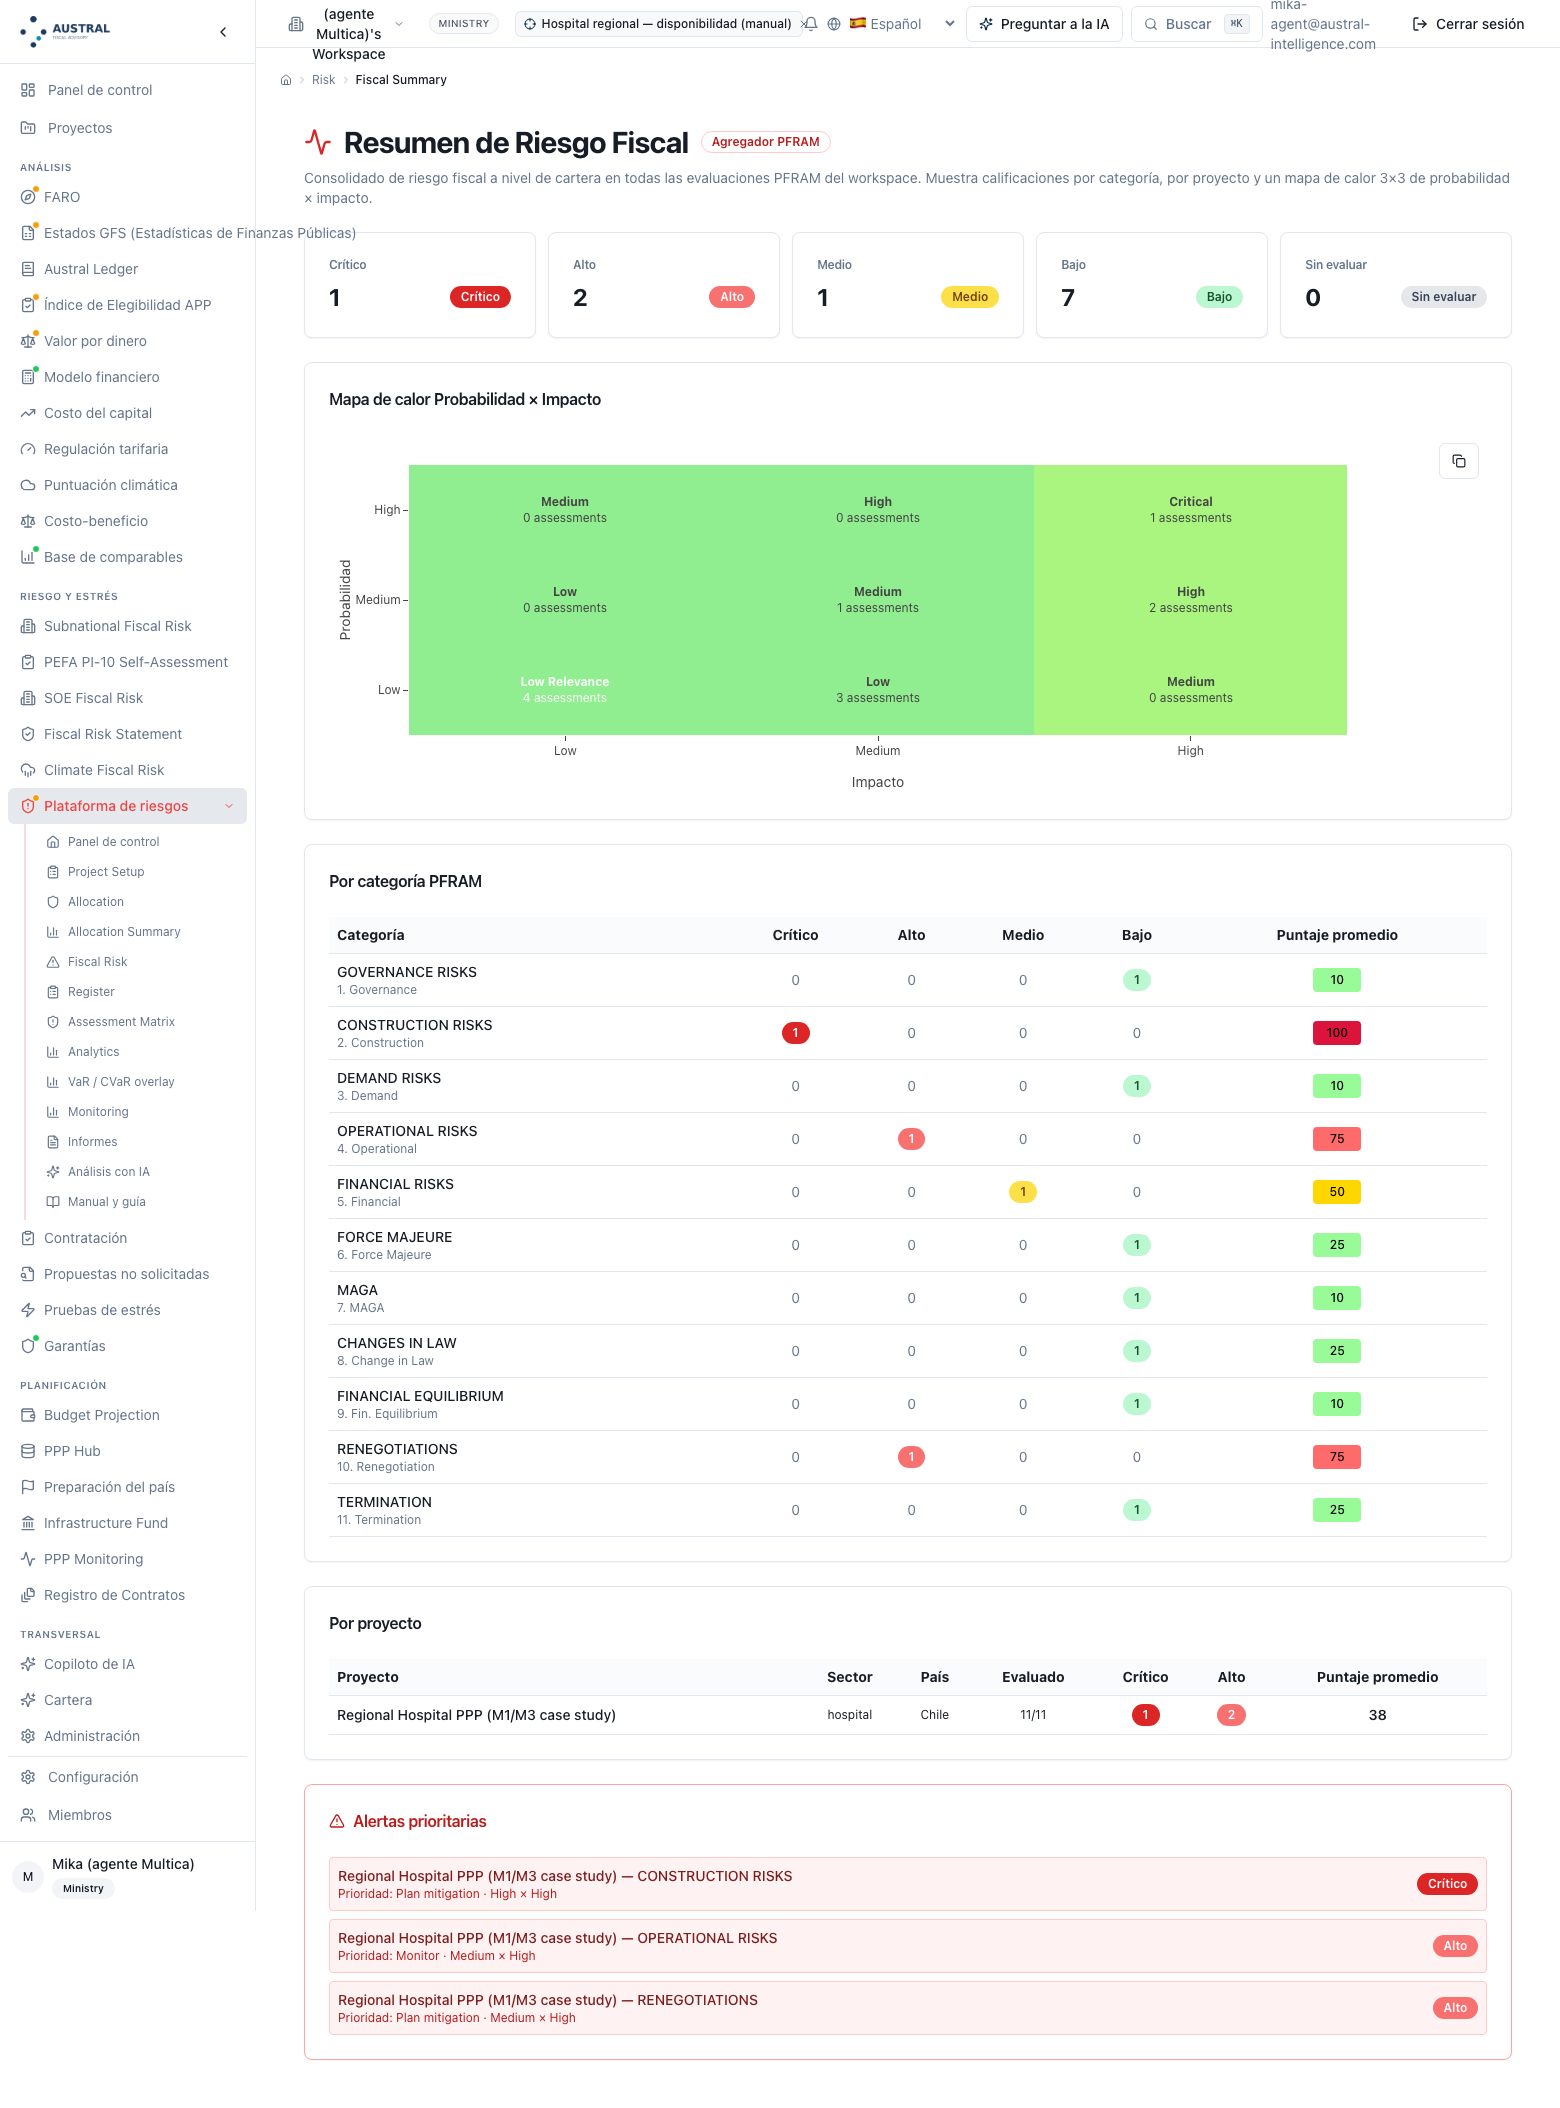
Figure 5.9 — Fiscal summary with the hospital: low 7 · medium 1 · high 2 · critical 1; "Construction Risks" in the high × high cell (1 assessment) with an average score of 100; "Operational Risks" and "Renegotiations" at high (75); "Financial Risks" at medium (50); the remaining seven at low or low relevance (10–25). (Step 9.) [note: the heat map's axis and cell labels ("Medium," "High," "Critical," "Low," "Low Relevance") print in English, as do the table's category names ("CONSTRUCTION RISKS," etc.), even though the rest of the screen is in Spanish.]
Label: Registro ("Register"; …/risk/register). Input: the row list from the most recent scenario's register: per row, the sector catalogue category (the Global Infrastructure Hub's seventeen, the same taxonomy as the allocation matrix and the cost‑of‑capital handoff), description, probability and impact on five levels (very low, low, medium, high, very high) before and after mitigation, owner (Public / Private / Shared), mitigation, status (open, in mitigation, in monitoring, closed) and deadline; rows can be added and deleted. Output: the 1–25 score before and after per row; filters by category, status and owner; and saving to the scenario's register, which since the September 2026 release is the same register monitoring, the checks, the Excel workbook, the tail layer and the handoffs read, and which since the second release keeps the catalogue category and both ratings on save. For the hospital: ten rows, with the works cost overrun at 16 → 9 and clinical demand at 12 before and 12 after (§4.4). Analyst's decision: Step 1 (the rows), Step 3 on its operational scale and Step 4 on its row‑level part (action, owner, date, status). Limit: the owner is the party, not an entity, and there is no verifier field (Step 4): the owner's and the verifier's names go in the mitigation text. This screen's colours and counters today use the same bands as the engine — 1–4 low, 5–9 medium, 10–16 high, 20–25 critical, the Austral convention the 5 × 5 matrix publishes (C10).
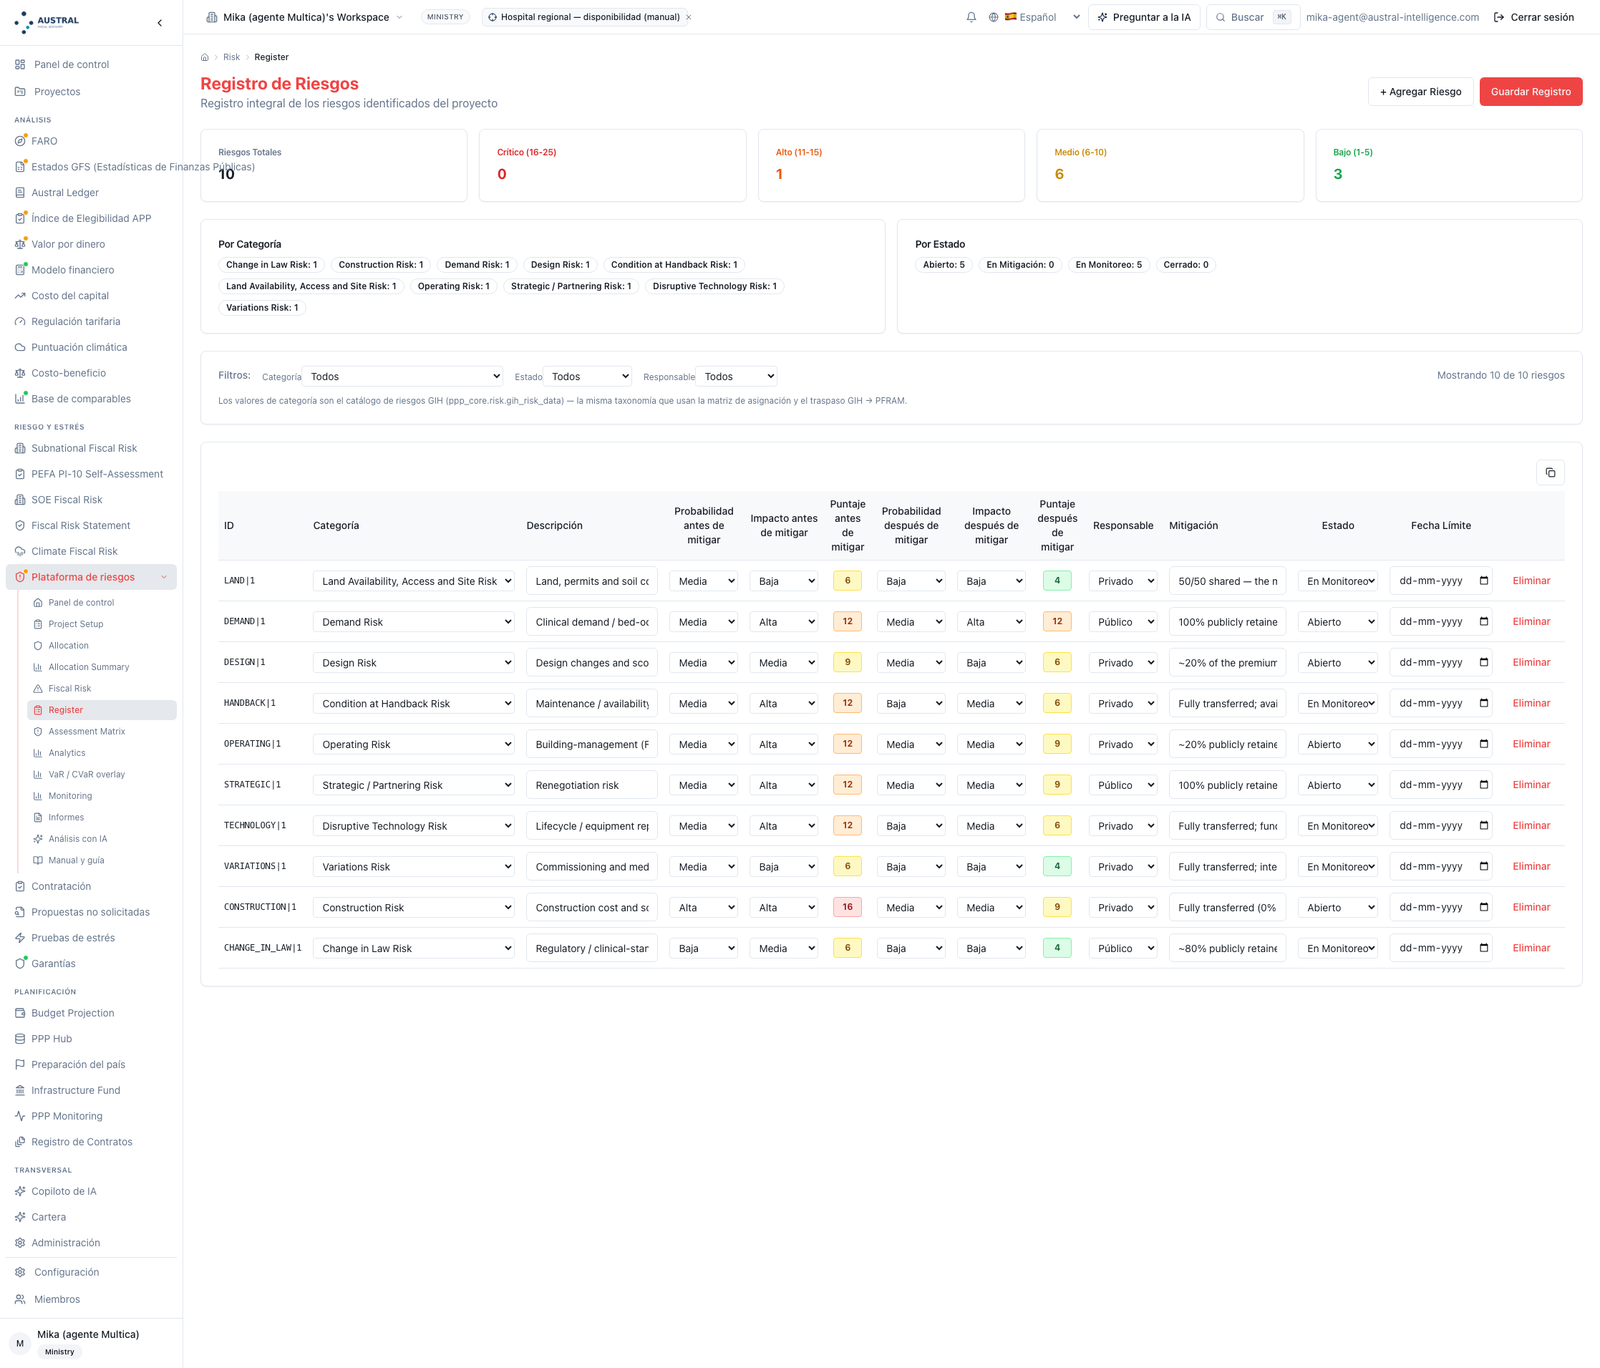
Figure 5.10 — The hospital's register: ten rows (with their pack's English names) with their catalogue category, five levels before and after, a 1–25 score (Construction Risk 16 → 9; Demand Risk 12 → 12), owner (Public / Private), status (open 5, in monitoring 5, in mitigation 0, closed 0); screen counters: critical (20–25) 0, high (10–16) 1, medium (5–9) 6, low (1–4) 3. (Steps 1, 3 and 4, the 5 × 5 scale.) [caption: the screen's counters use the engine's bands, the same as the 5 × 5 matrix's (figure 5.11).]
Label: Matriz 5 × 5 ("5 × 5 matrix"; …/risk/matrix-5x5). Input: the engine's 25‑cell grid, with score, band and colour, and the framework's name with a note cross‑referencing the fiscal risk's 3 × 3; and a list of rows to score, preloaded from the scenario's register — empty if no rows are saved, with an explicit action to load deletable factory rows — each with probability and impact before and, optionally, after mitigation. Output: per row, the score and the band before and after, and the summary by band. For the hospital: works cost overrun 16 → 9, building‑management services 12 → 9, clinical demand 12 → 12, residual density low 3 · medium 6 · high 1 (§4.4). Analyst's decision: Step 3's "before and after" rating, with the bands the method publishes. Limit: the screen does not write back to the register: the scored result is carried over by hand. The bands are an Austral convention and the screen says so in the framework note.
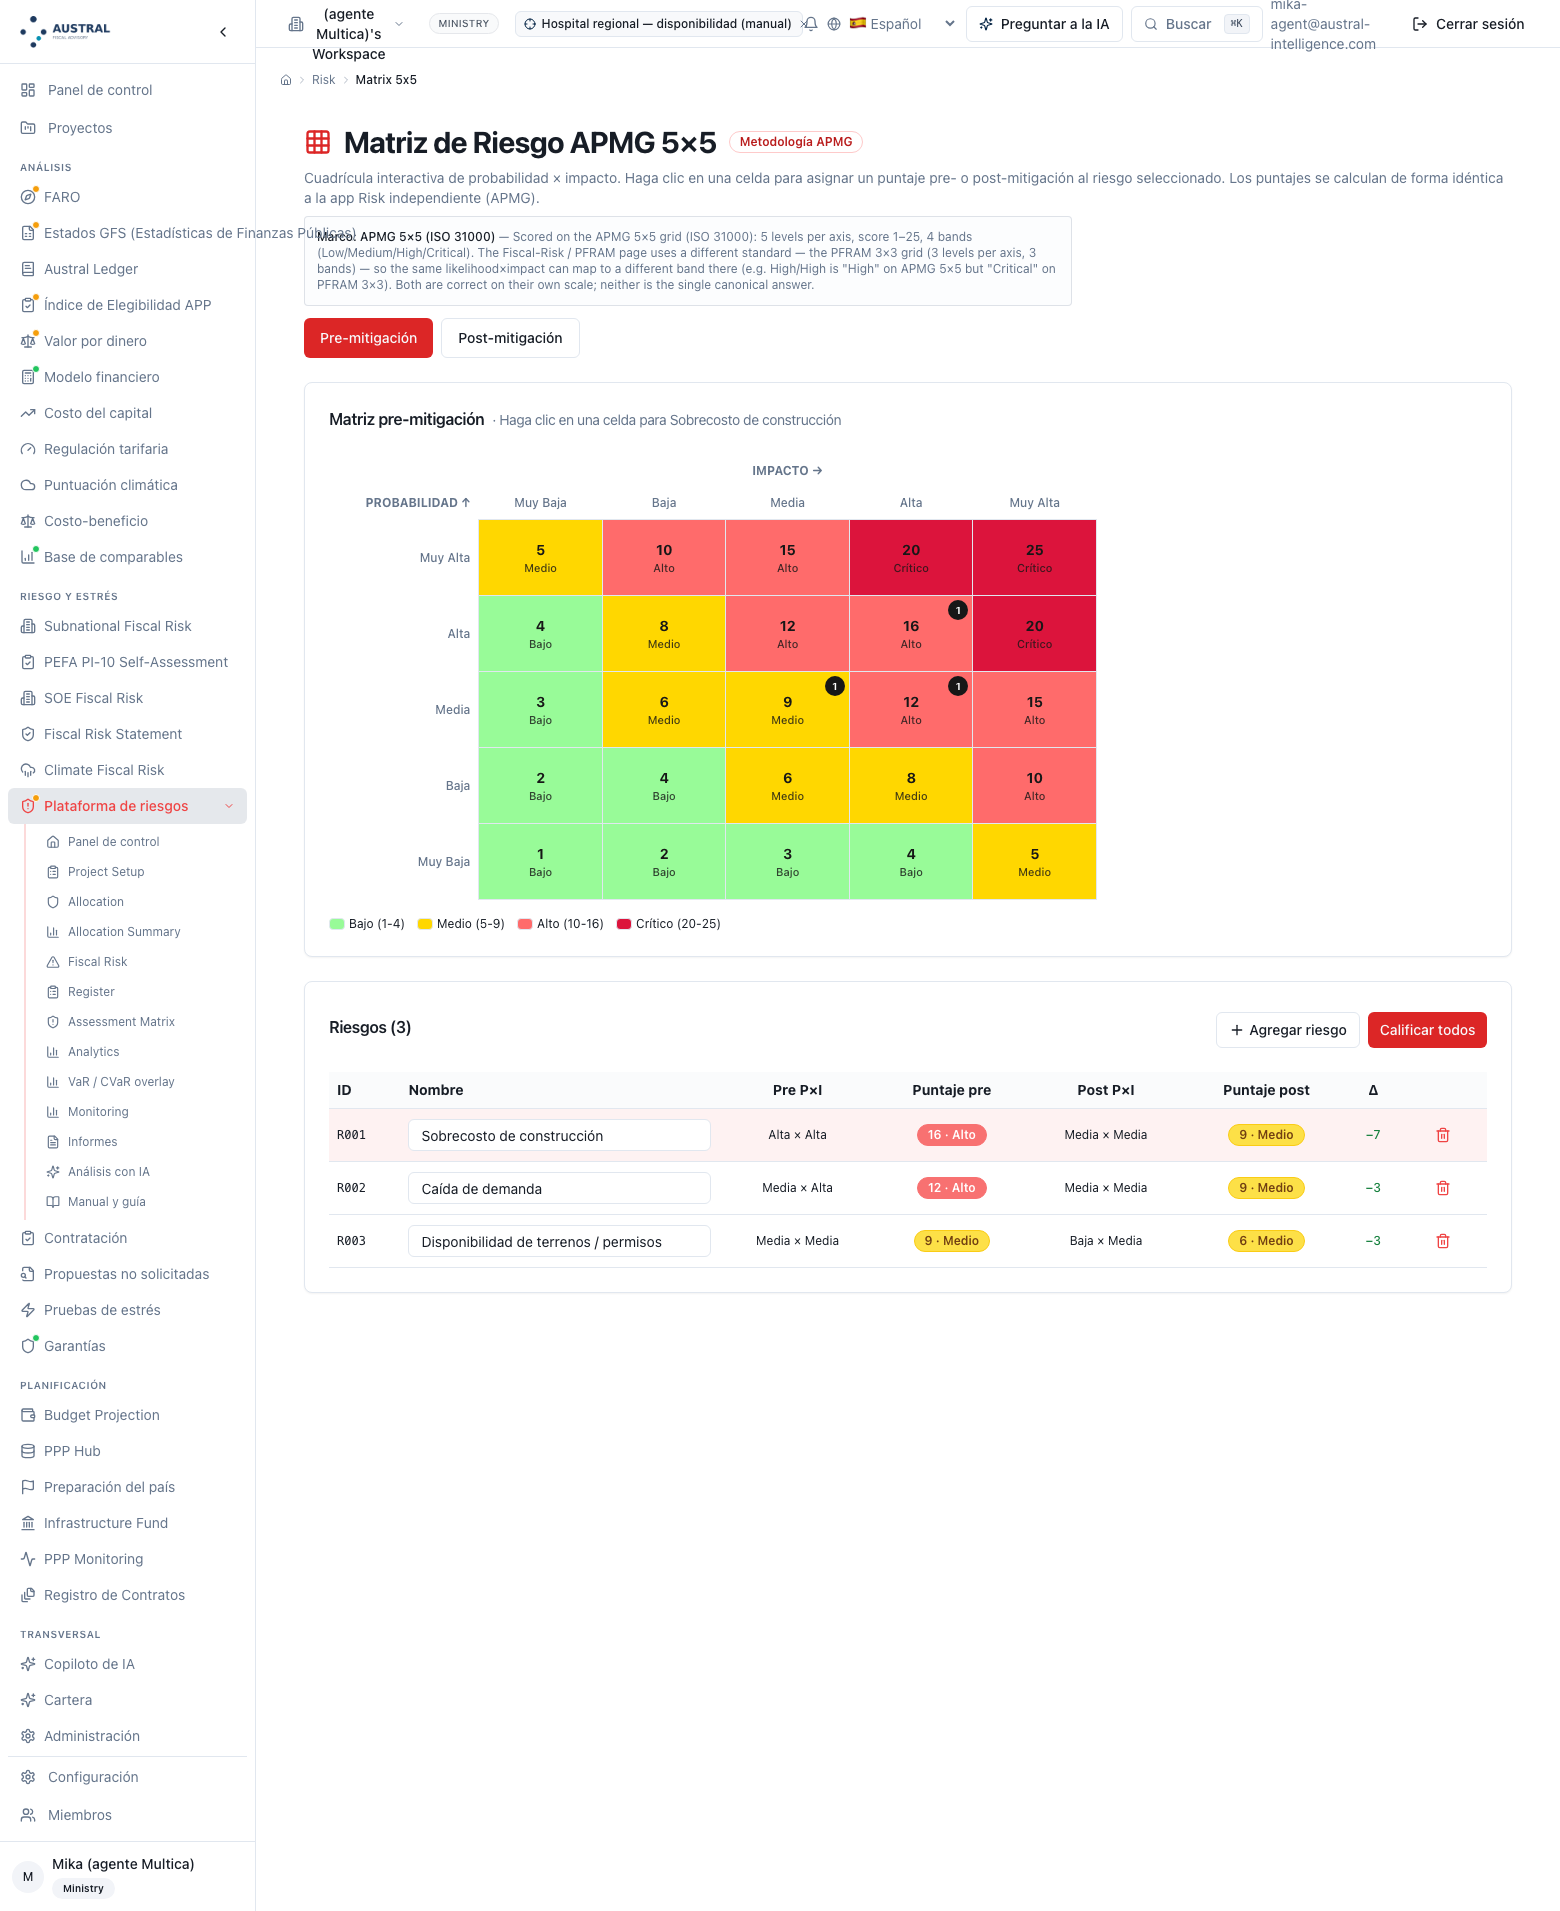
Figure 5.11 — 5 × 5 matrix: the 25‑cell grid with the four bands, and three scored rows: "Sobrecosto de construcción" ("Construction cost overrun") 16 high → 9 medium, "Caída de demanda" ("Demand drop") 12 high → 9 medium, "Disponibilidad de terrenos/permisos" ("Land/permit availability") 9 medium → 6 medium. (Step 3.) [note: the screenshot predates the production fix that now preloads this screen from the scenario's register (§5.1); it shows the three factory rows the screen used to carry, unrelated to the hospital_m1 pack. It will be retaken over the hospital's register in the manual's next version.]
Label: Verificaciones de consistencia ("Consistency checks"; …/risk/validation). Input: one scenario or the whole workspace. Output: the list of findings in three severities — error, warning, information — with a code, a message and context: an empty or incomplete fiscal reading; register rows with no mitigation, no owner, no rating, or high with no residual; high or critical fiscal risk whose catalogue category is allocated to the private party; rows with a category not in the catalogue. For the hospital: three errors — critical construction to the private party, twice (construction and design); high operation to the private party — and no warnings (§4.8.2). Analyst's decision: resolving or declaring each finding: the hospital's three are declared, because the guarantee backing the transfer exists in the justification (fixed price, bonds, deductions) and the check has no field to see it in. Limit: four checks the method requires and the screen does not run, declared in 5.10: it does not compare the register with the fiscal reading (demand "high" in one and "low relevance" in the other passes with no flag); it reads the owner as non‑empty text, so the party (⟨Public⟩) passes as an owner; it does not read the percentage matrix, only the scenario's party; and it does not see guarantees or bonds. And it does not check the version (Step 9): it is the analyst who saves one scenario per milestone.
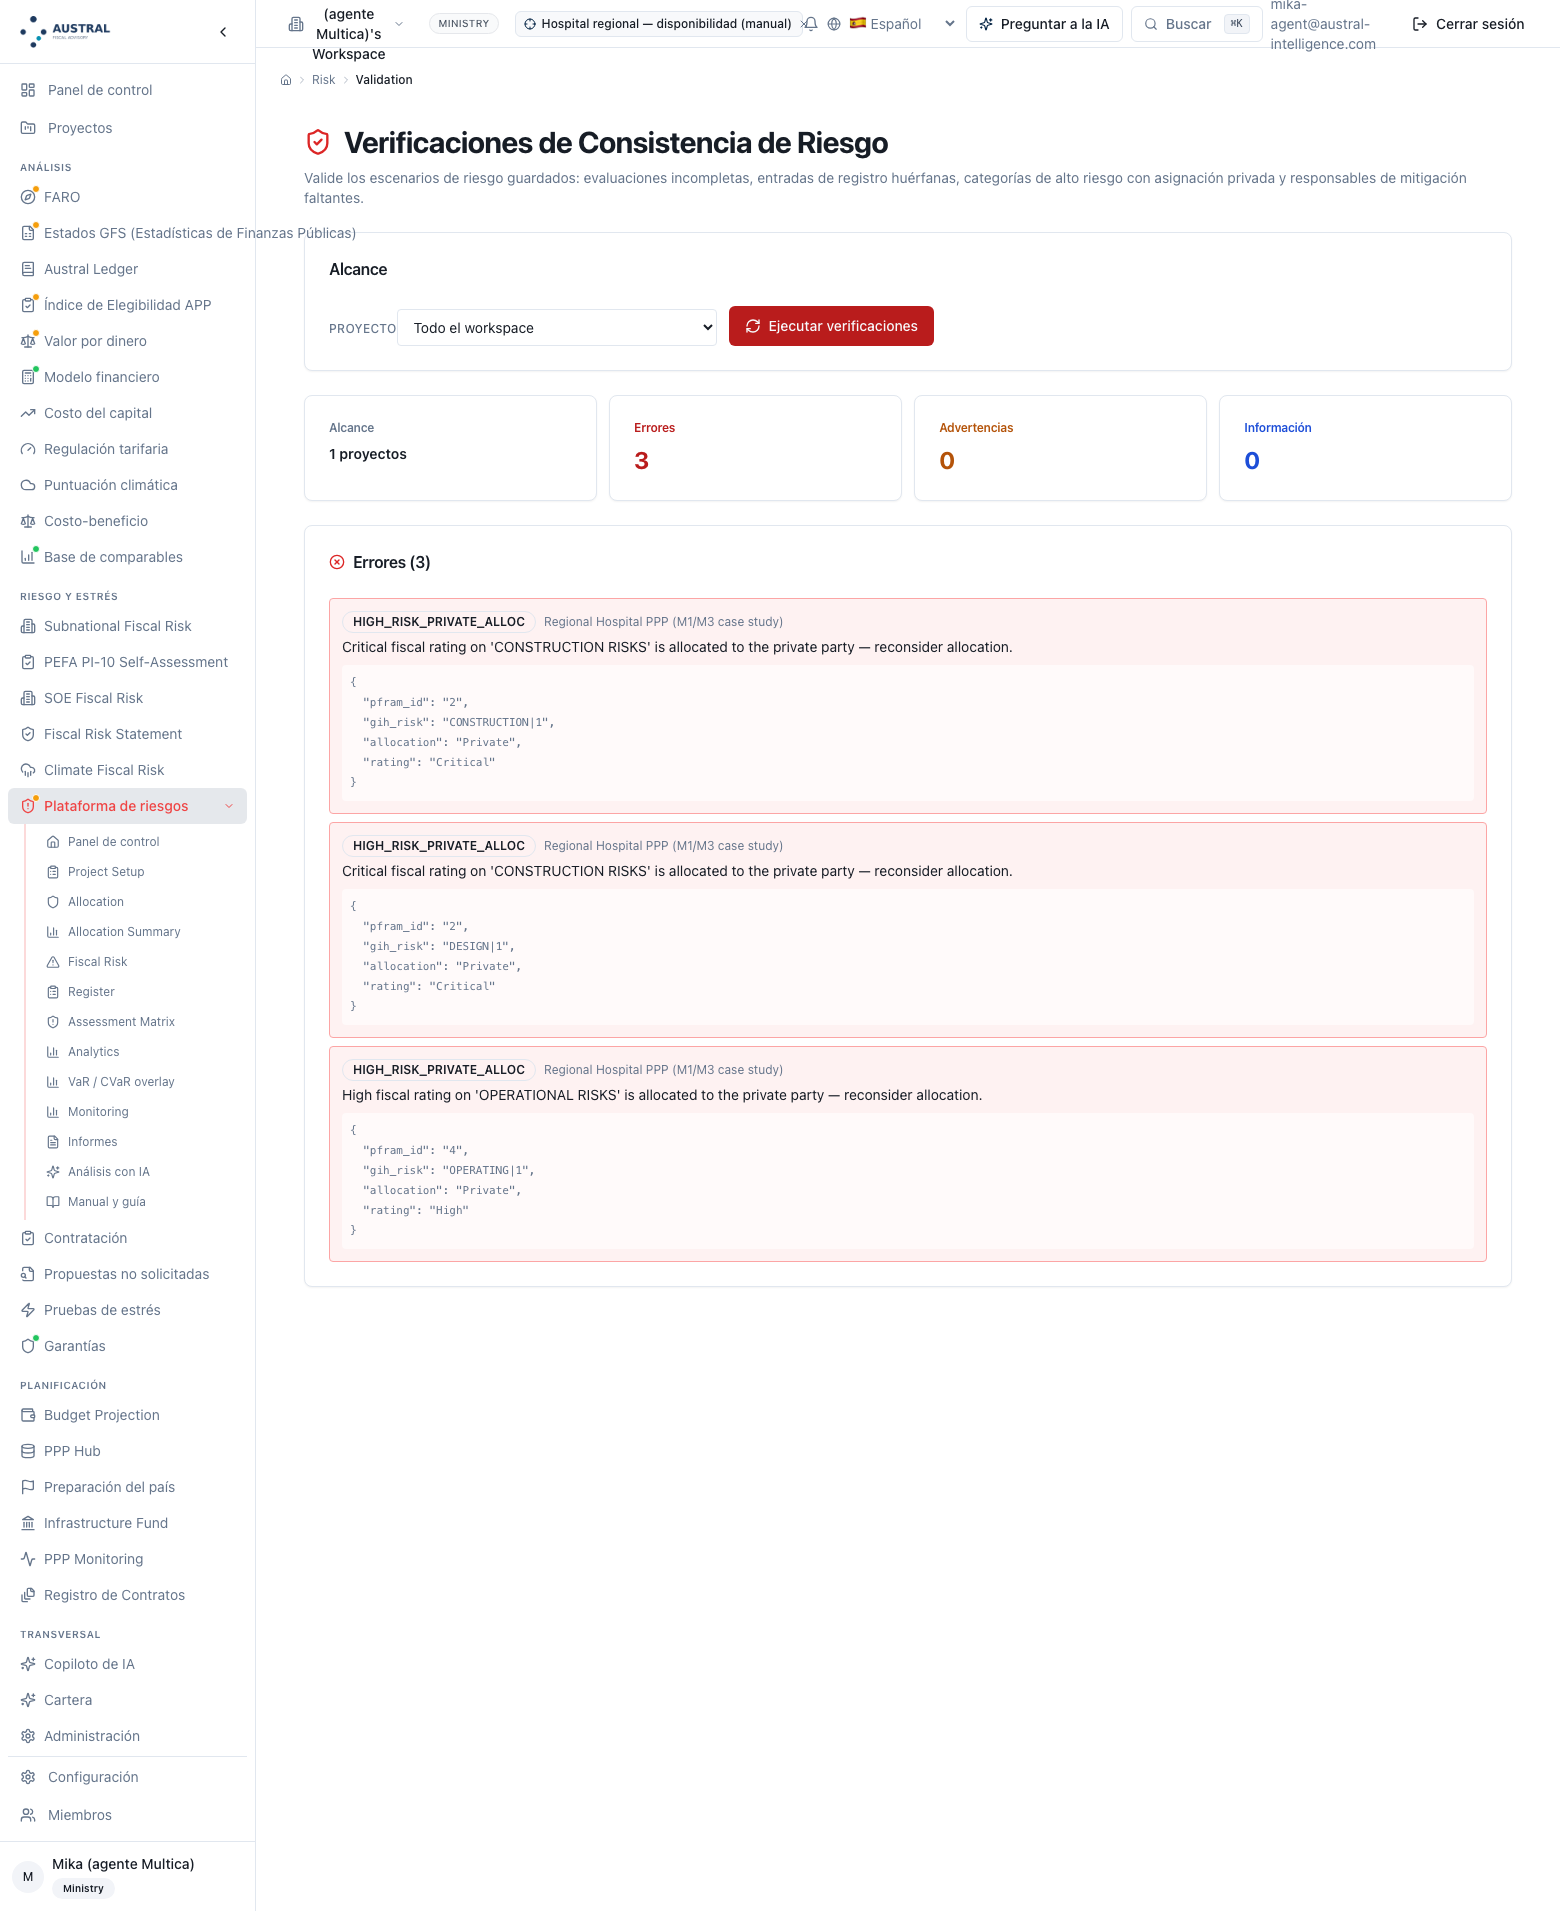
Figure 5.12 — The hospital's consistency checks: 3 errors, 0 warnings, 0 information — "Critical fiscal rating on 'CONSTRUCTION RISKS' is allocated to the private party" (twice: construction and design), "High fiscal rating on 'OPERATIONAL RISKS' is allocated to the private party." (Step 9.) [note: the findings' messages print in English, as does the HIGH_RISK_PRIVATE_ALLOC code and the context JSON, even though the screen hosting them is in Spanish.]
Label: Capa VaR / CVaR ("VaR / CVaR layer"; …/risk/var-overlay). Input: per risk, name, category, probability of occurrence, distribution (triangular: minimum, mode, maximum; normal: mean, standard deviation; lognormal) and its parameters; N (500 to 100,000; opens at 5,000); the preload from the register button, which reads the most recent scenario's register and translates each row into a probability (0.1 / 0.3 / 0.5 / 0.7 / 0.9 per level) and a triangular in abstract units (mode 1 / 5 / 15 / 40 / 80 per impact level; minimum 0.4 and maximum 2.5 times the mode), editable. Output: the mean, median, standard deviation and maximum loss; VaR and CVaR at 90, 95 and 99%; the histogram; the contribution per risk (expected loss, frequency, share of the mean); and the seed it ran with, printed next to the chart ("reproducible with seed 42"). For the hospital, with the five retained rows typed in dollars from the comparator's scale (§4.6.2): mean ⟨26.49⟩, VaR95 ⟨53.48⟩, CVaR95 ⟨59.40⟩, renegotiation ⟨52%⟩ of the mean. Analyst's decision: all of Step 6: each row's distribution, its probability (Step 5's, not the preload's), N, and the decision to type in the monetary base, because the preload does not have one. Limit: three, declared. (i) The preload is in units that are not money and on a different probability scale from the comparator's (0.7 versus 0.75 for "high"; §6.3): it is a starting point and the manual does not use it as a figure. (ii) The seed is not chosen from the screen: it defaults to 42 in the engine, is printed, and a different seed is only passed through the API (5.9) — for Step 6's rule this is enough: the published figure is reproducible. (iii) It sums independently, and the screen's note says so; the correlated case goes to the frontier's correlated variant (5.6) and to portfolio stress testing (M9). The screenshot shows the retained book in dollars, typed in — five rows, §4.6.2's figures and the printed seed — and not the register preload, which is what the reader will see first on pressing the button: the manual's figure is the dollar book's, and the preload is in the caption.
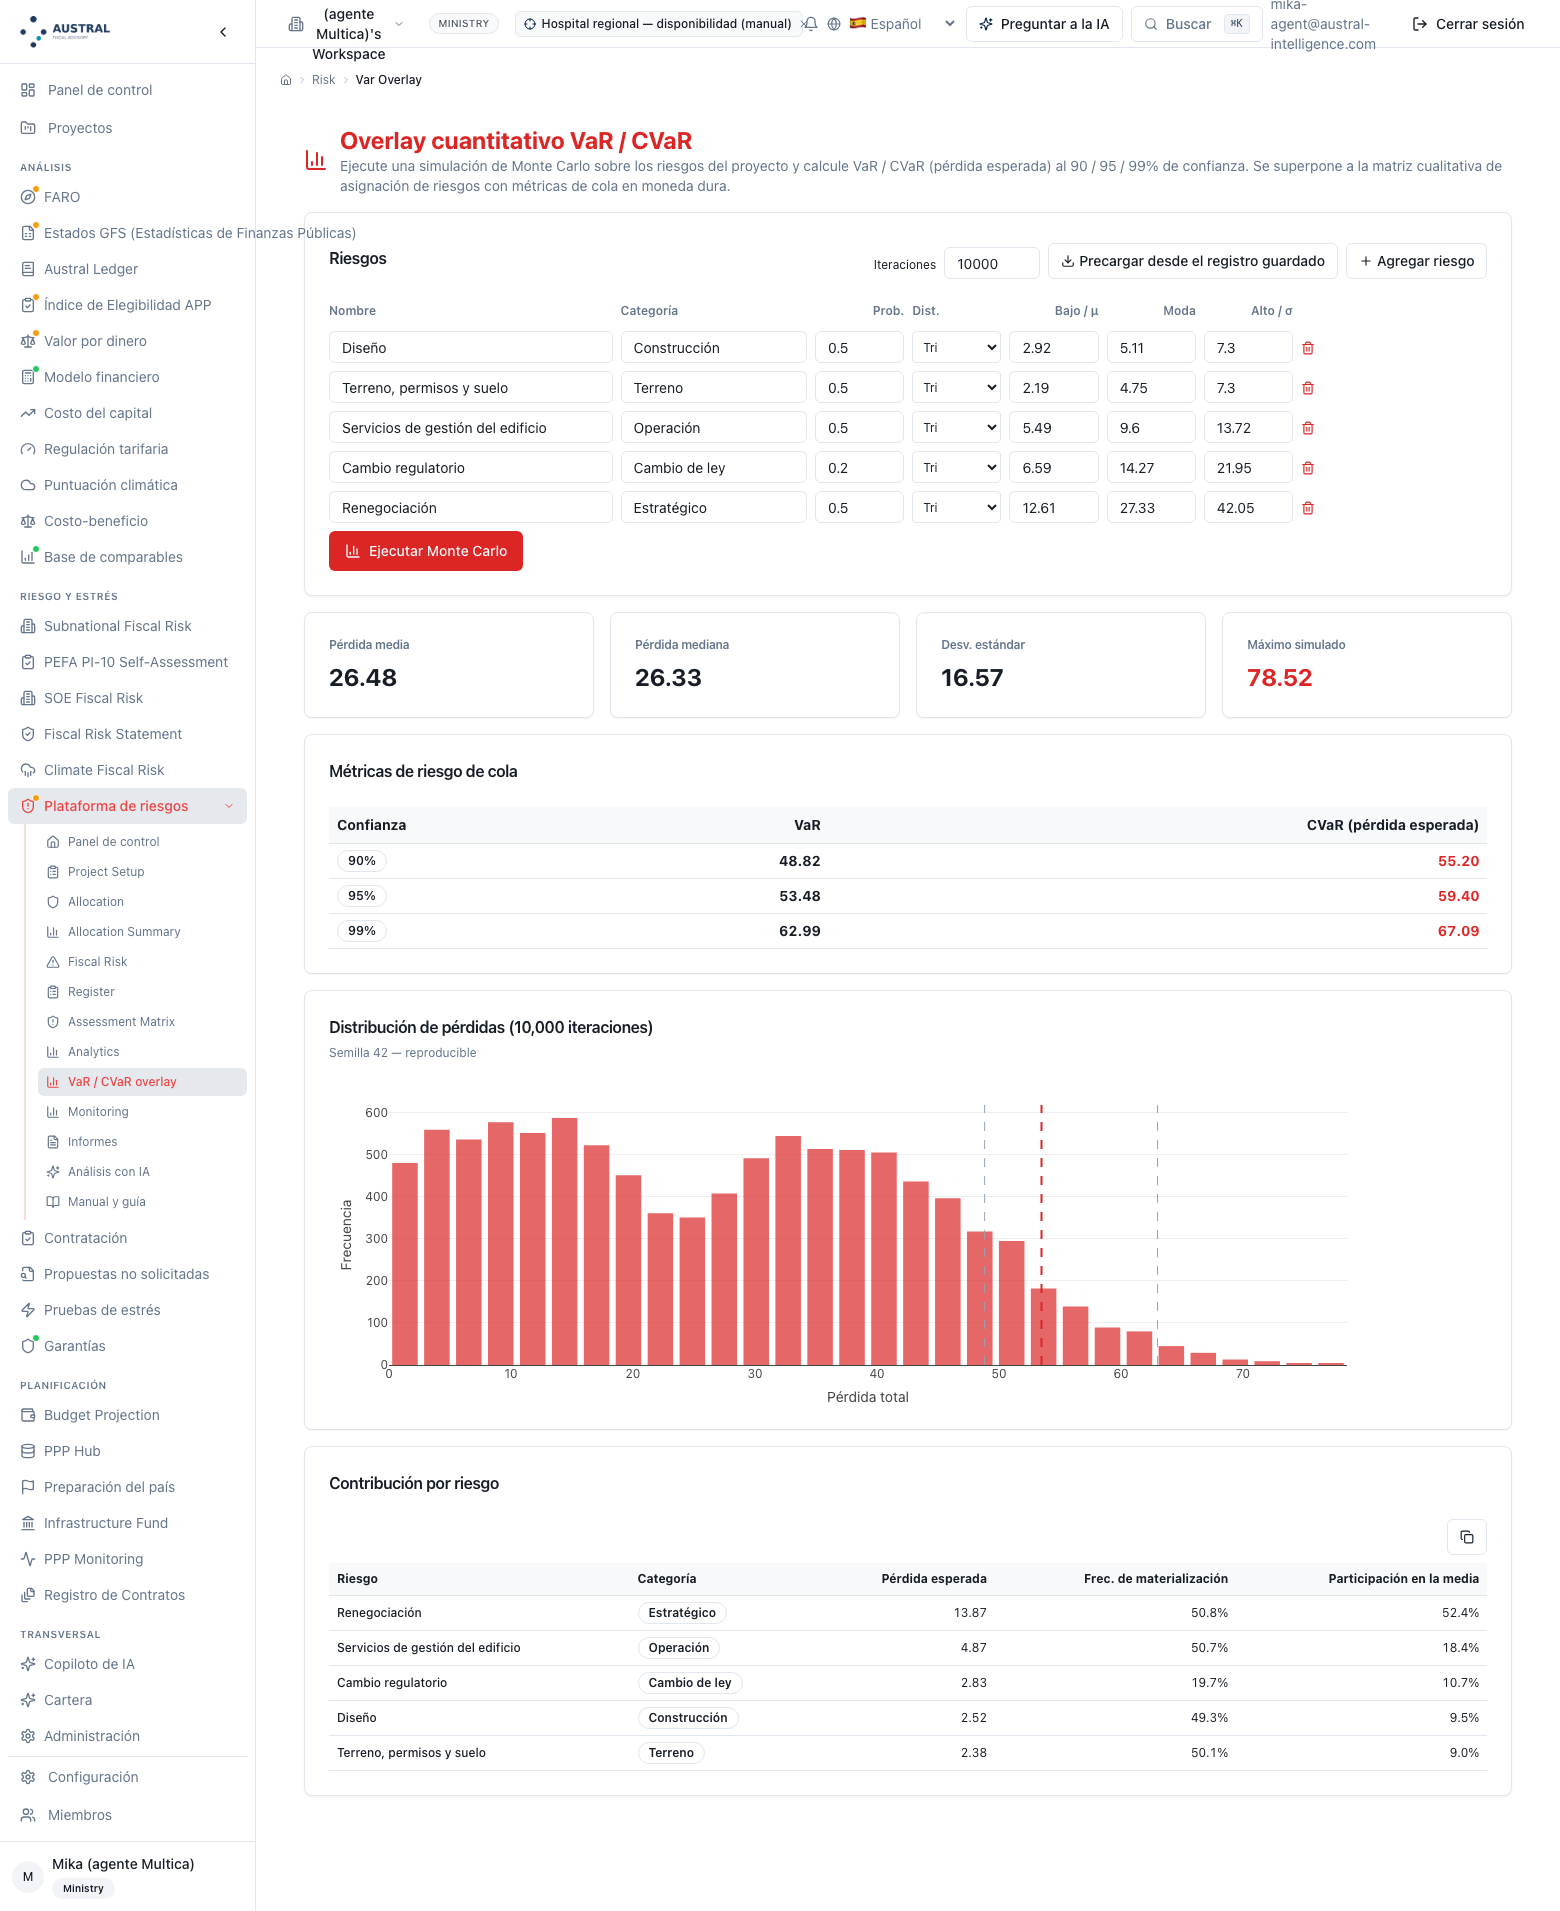
Figure 5.13 — VaR / CVaR layer with the hospital's retained book: five triangulars in US$M — design 2.92 / 5.11 / 7.30 with p 0.50; land 2.19 / 4.75 / 7.30 with p 0.50; building‑management services 5.49 / 9.60 / 13.72 with p 0.50; regulatory change 6.59 / 14.27 / 21.95 with p 0.20; renegotiation 12.61 / 27.33 / 42.05 with p 0.50 — N 10,000; mean 26.48, median 26.33, standard deviation 16.57, simulated maximum 78.52; VaR90/CVaR90 48.82/55.20, VaR95/CVaR95 53.48/59.40, VaR99/CVaR99 62.99/67.09; contribution to the mean: renegotiation 52.4%, building‑management services 18.4%, regulatory change 10.7%, design 9.5%, land 9.0%; "Semilla 42 — reproducible" ("Seed 42 — reproducible"). (Step 6.) [caption: "the register preload carries ten rows in abstract units; the dollar bands are the comparator scale's, §4.6.2." The figure reproduced on production (mean 26.48) reconciles with §4.6.2's (26.49) to the screen's rounding.]
Label: Monitoreo ("Monitoring"; …/risk/monitoring). Input: the registers of every scenario in the workspace. Output: rows by status (open, in mitigation, in monitoring, closed), by residual severity (the impact after mitigation) and by catalogue category; alerts for high or very high residual, with the message "elevated residual risk after mitigation"; and the table by scenario (rows, high‑risk items). For the hospital: open 5 · in monitoring 5; residual low 4 · medium 5 · high 1; one alert, clinical demand (§4.8.3). Analyst's decision: reading by residual — the row still high is the one to pay for (clause) or watch (date) — and changing each row's status from the register (C9) when the owner says to. Limit: it is workspace‑wide, with the per‑scenario table as a breakdown: for the screenshot's figures to match §4's, the workspace has to hold only the hospital, or the hospital's row has to be read in the table. It measures residual severity by the "after" impact and not by the 5 × 5 score: a high × low row and a low × high one are both "high" and "low" here, and both 5 and 5 on the grid; the method reads by score. And it does not show the register's deadline or have a verifier, both of which are the method's (Step 4).
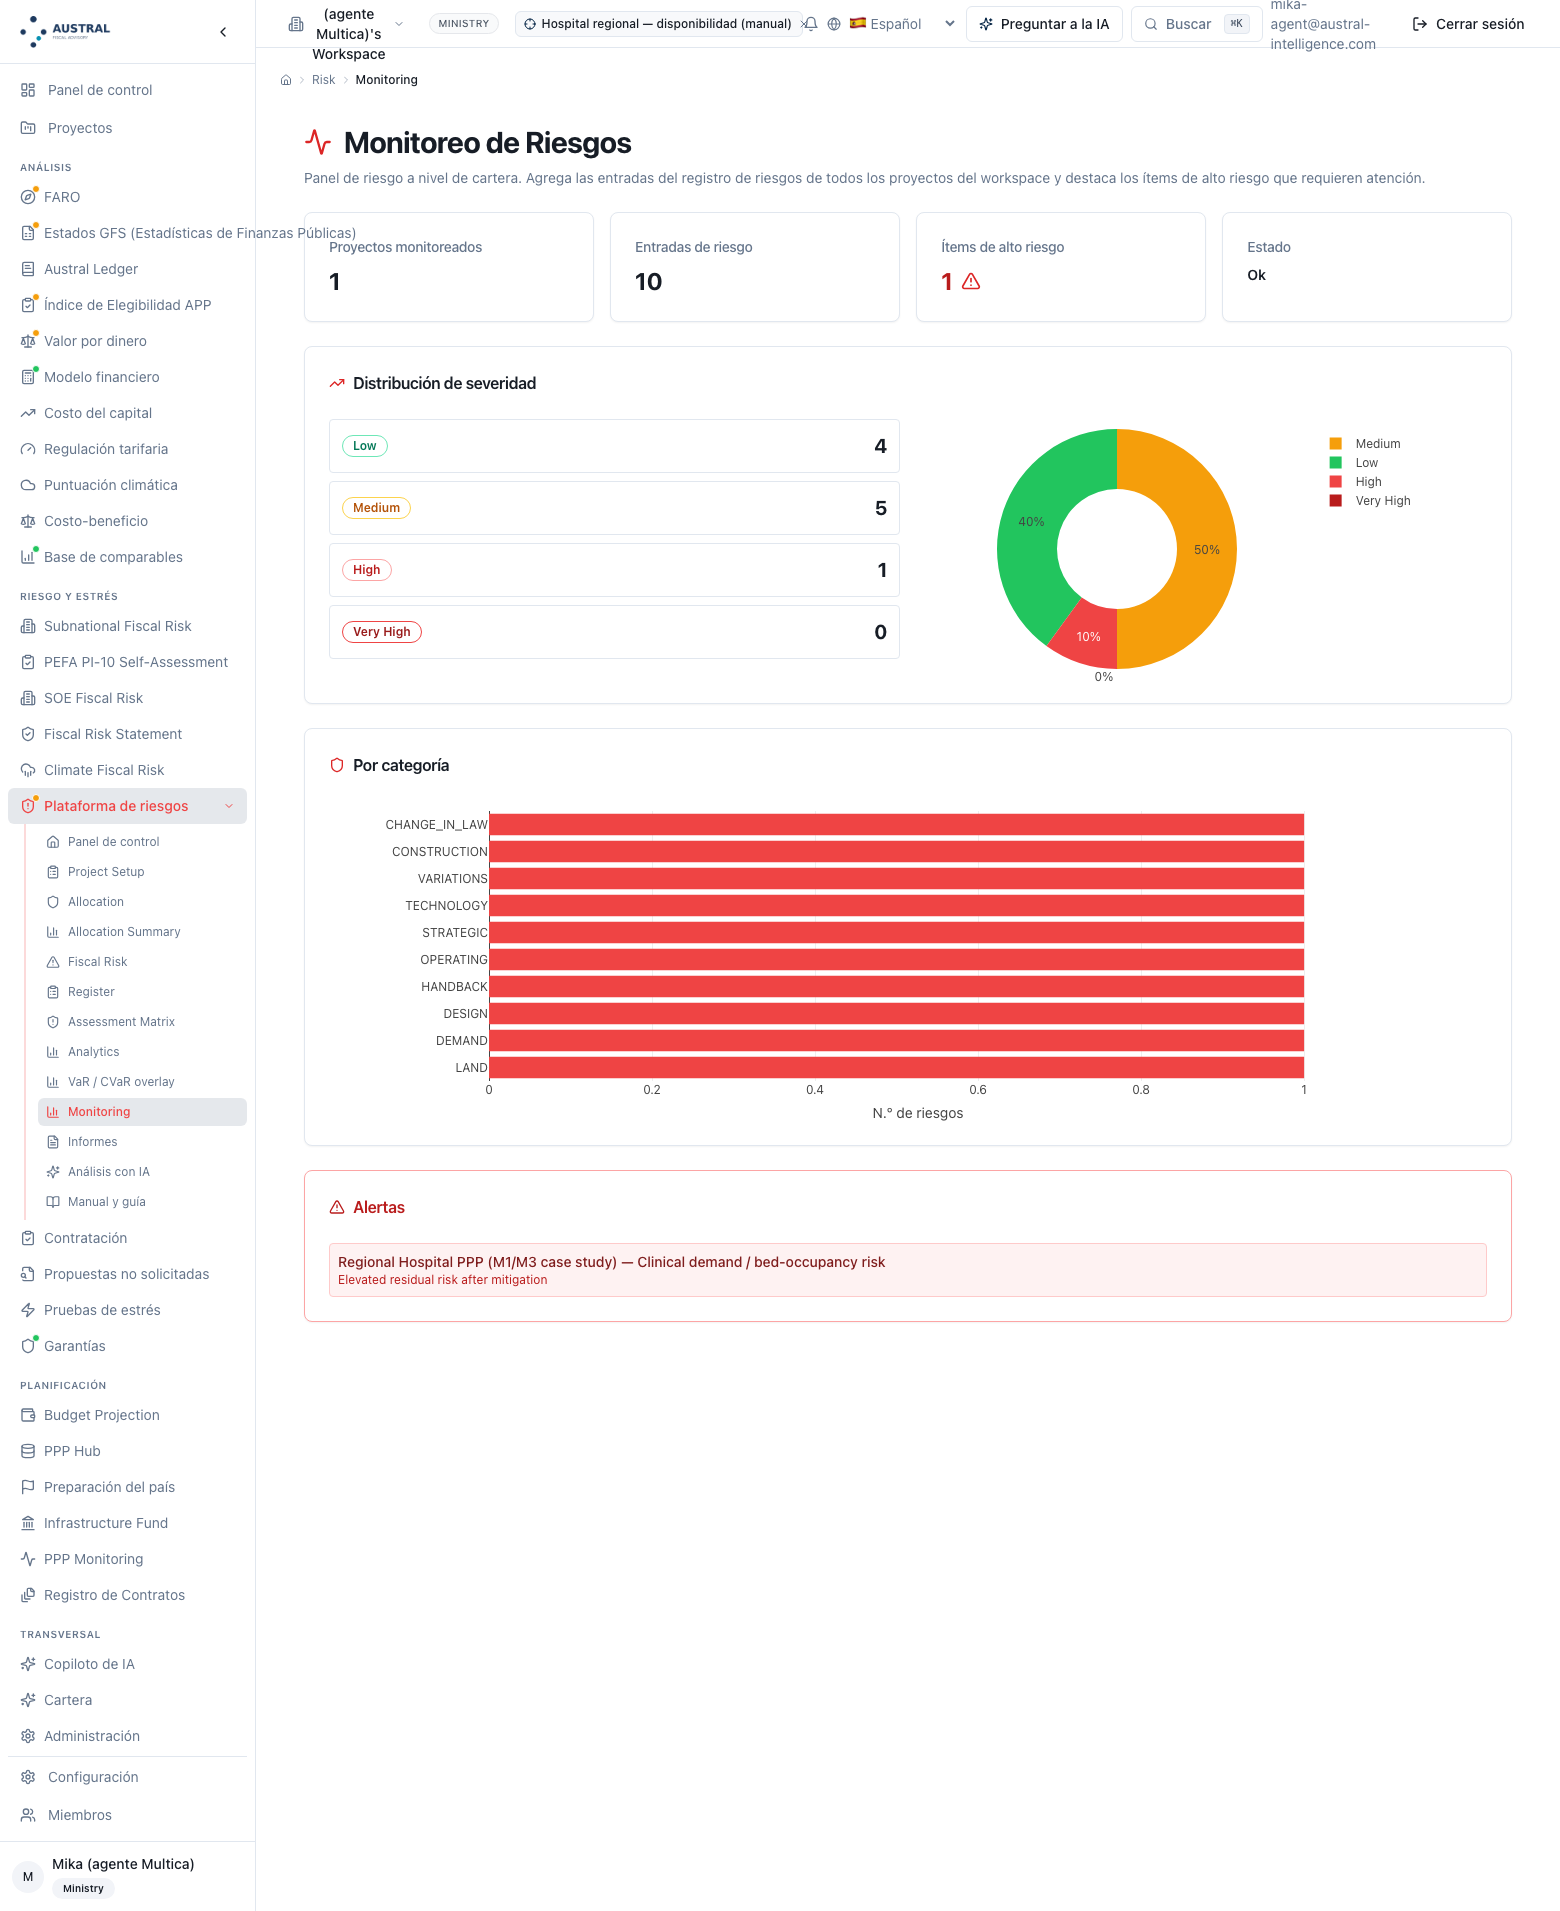
Figure 5.14 — Monitoring with the hospital: monitored projects 1, risk entries 10, high‑risk items 1, status "Ok"; by residual severity: low 4 (40%) · medium 5 (50%) · high 1 (10%) · very high 0; by catalogue category, the ten rows at 1 each; alert "Regional Hospital PPP (M1/M3 case study) — Clinical demand / bed‑occupancy risk: Elevated residual risk after mitigation." (Step 9.) [note: the severity labels (Low/Medium/High/Very High) and the category ones (CHANGE_IN_LAW, CONSTRUCTION, etc.) print in English. No per‑scenario table separate from the four header figures is visible — with a single project in the workspace there is no breakdown to show — so this screenshot does not illustrate that part of the caption.]
Label: Informes ("Reports"; …/risk/reports) and the download from the home screen. Input: the scenario and the text type. Output: three AI texts — executive summary, risk narrative, recommendations — over the scenario's matrix, fiscal reading and register, with the model that produced them (named in one line; not part of the method); and, from the home screen, the workspace's Excel workbook, five sheets labelled in the session's language: general summary (one line per scenario: register rows, assessed fiscal categories), risk register (every row from every scenario: catalogue category, name, probability and impact before and after, status, mitigation, owner), PFRAM matrix (the eleven categories per scenario: probability, impact, mitigation, strategy, responsible party), allocation (each register row with its party — Public / Private / Shared — its catalogue category and the fiscal category it corresponds to, both ratings, the owner, and a verifier column that today stays empty) and monitoring (a count by residual impact and by category). Analyst's decision: the workbook is the version of the matrix that goes into the file (Step 9): it is downloaded at every milestone and saved under the version's name. Limit: the allocation sheet carries the party per row, not the percentages or the justifications from Step 2: those travel only in the interchange‑format session (complete scenarios: profile, allocation with justifications, fiscal reading, register), which is exported and imported only through the API and has no screen. And the workbook is not the tender‑document‑format matrix annex (Step 8), which the module does not produce and §4.8.1 writes by hand. The screenshot shows the reports screen and the workbook: the workbook is §6.7's audit piece, as in the Value for Money and Eligibility manuals, and the reports screen is the one with a route.
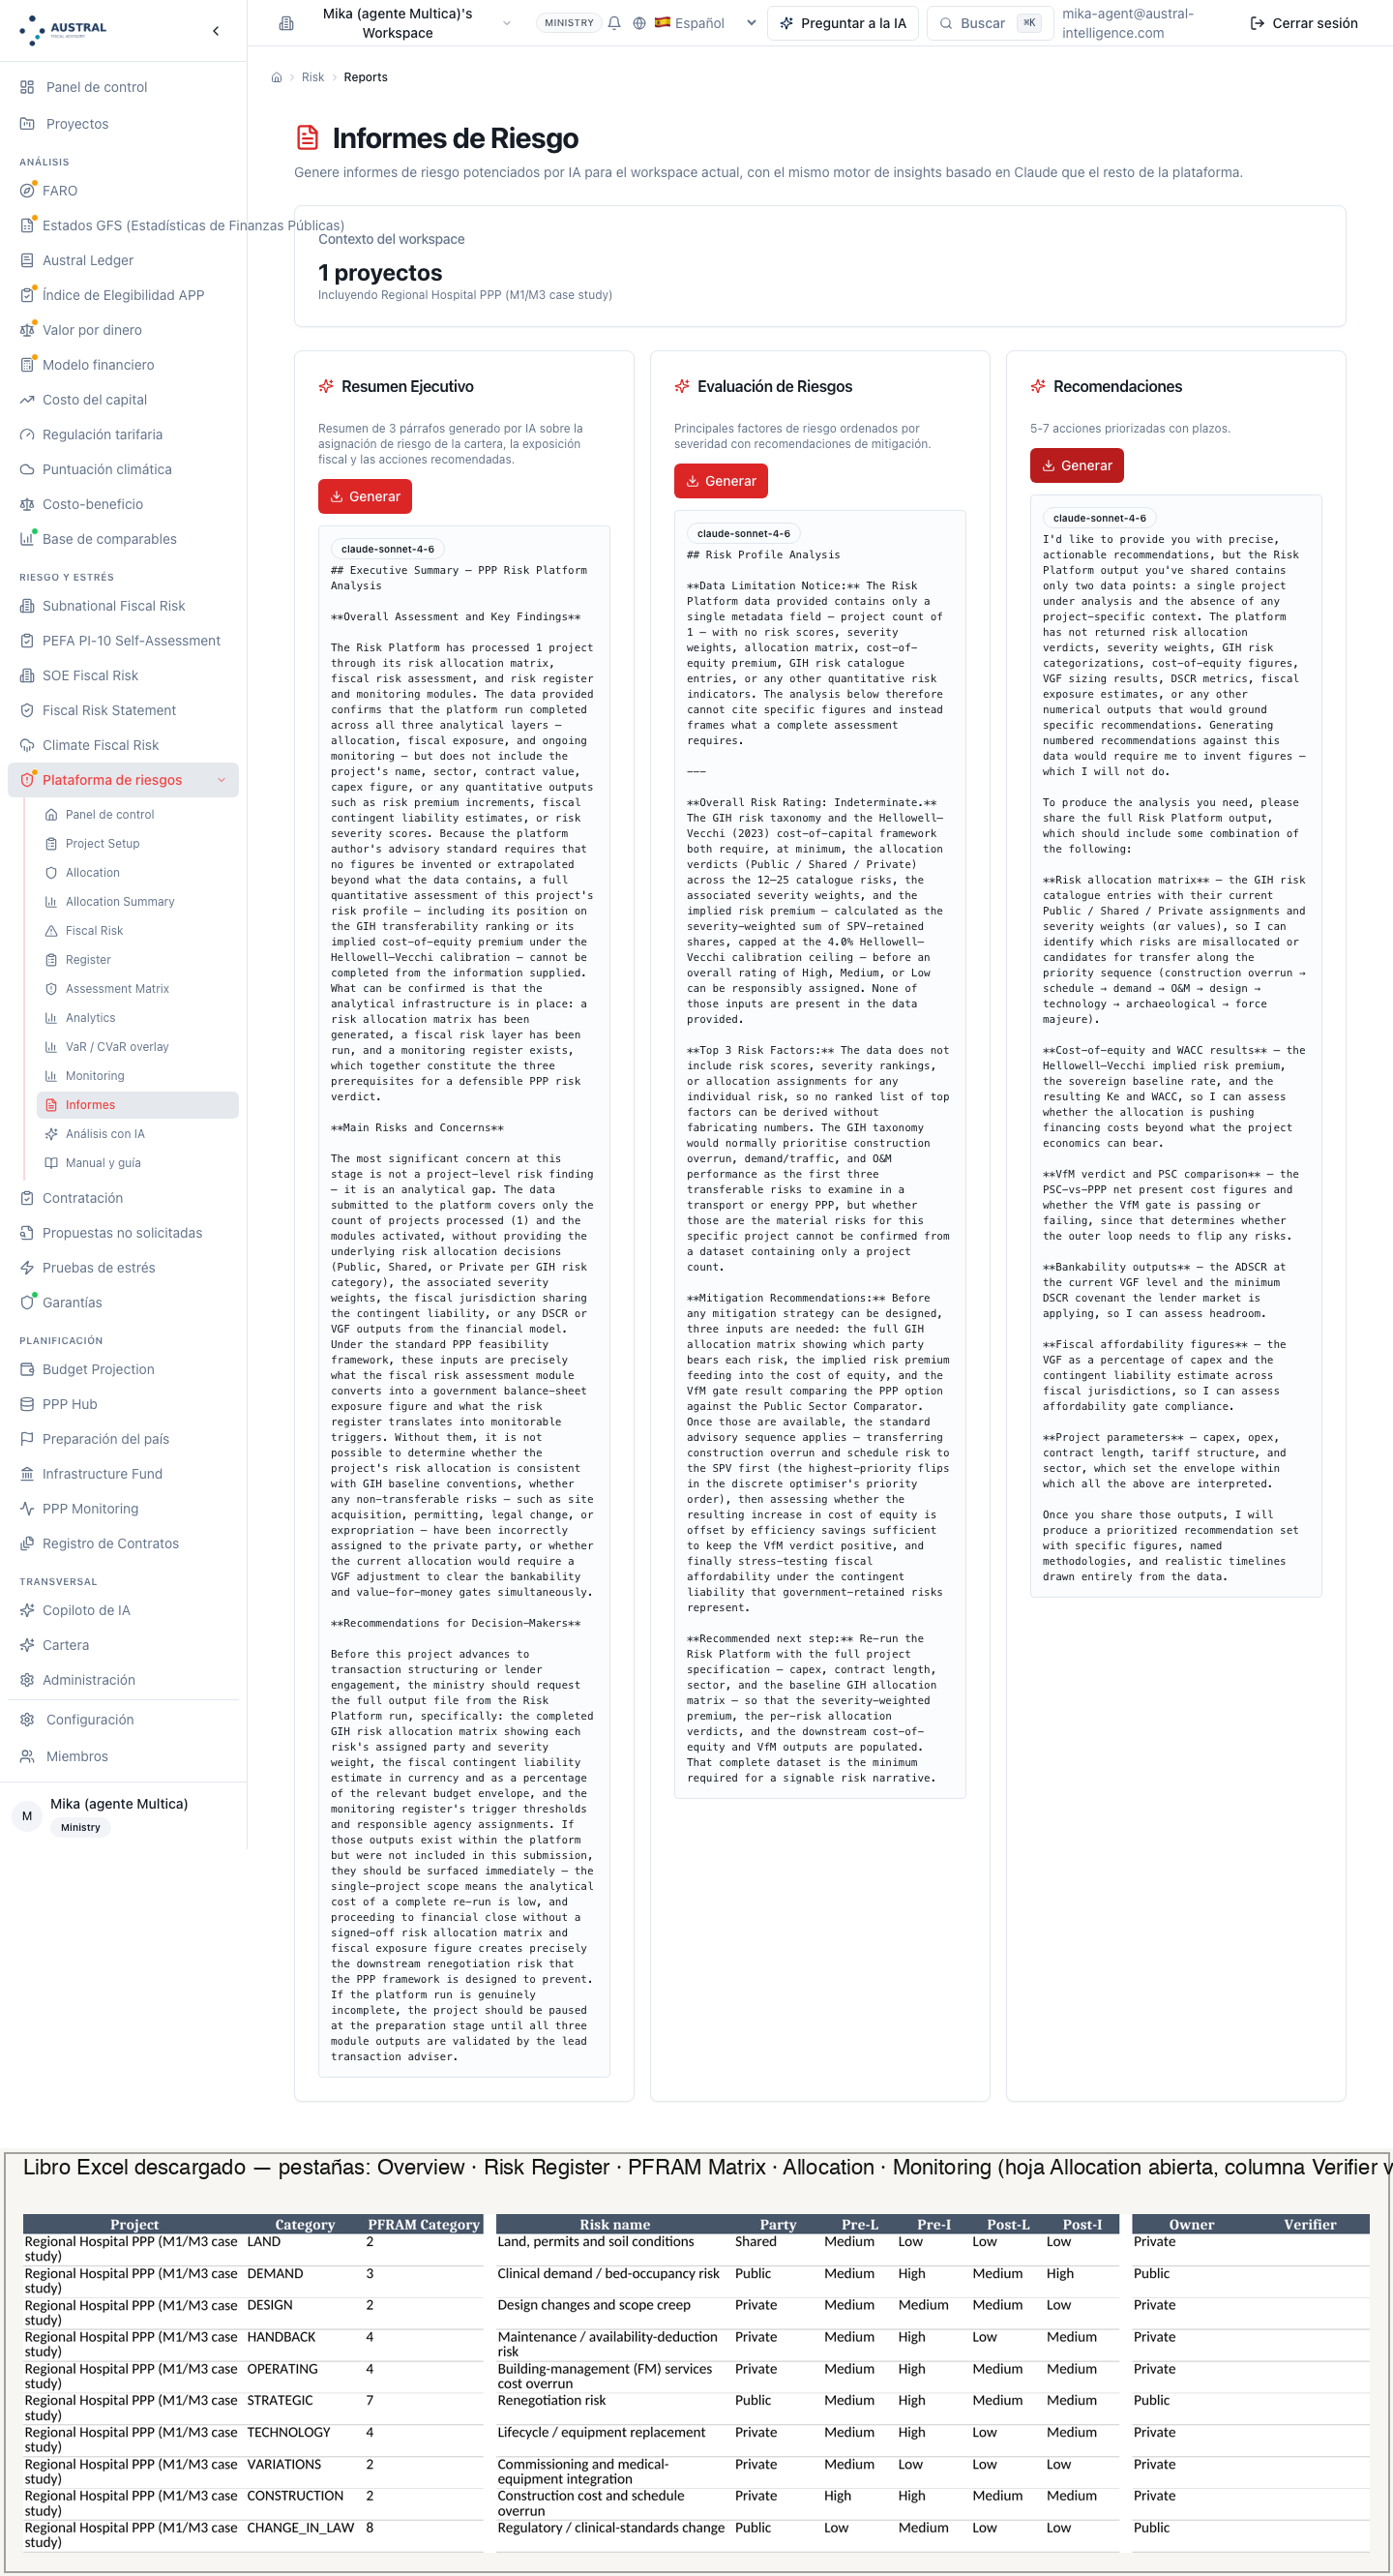
Figure 5.15 — Reports: the three "Generar" ("Generate") buttons pressed over the hospital; and, in the lower box, the five sheets of the downloaded Excel workbook (Overview, Risk Register, PFRAM Matrix, Allocation, Monitoring) with the allocation sheet (Allocation) reproduced, the Verifier column empty. (Step 9; §6.7.) [note: the screenshot predates two production fixes: the three AI texts now receive the scenario's matrix, register and fiscal reading instead of the empty context this run returned, and the Excel workbook is now labelled in the session's language instead of in English. It will be retaken in the manual's next version.]
Label: Valor por Dinero → Asignación de riesgos ("Value for Money → Risk allocation"; …/vfm/risk). Input: the comparator's register: per risk, name, phase, probability and impact on the published scale, nature (specific / systematic) and five‑degree allocation (100 / 80 / 50 / 20 / 0% retained). Output: the expected‑premium preview per row and total, with the 30% cap, and the split §4.6.1 prints. For the hospital: premium ⟨117.05⟩ against a ceiling of ⟨126.15⟩ at two rates. Analyst's decision: none new — Step 2's matrix is reloaded here with its degrees, because today's handoff from the Risk Platform delivers an indication (retained/transferred fraction) and not the row‑by‑row register (5.8). Limit: it is the only screen on the platform where risk is worth money, which is why Step 5 lives here (5.5).
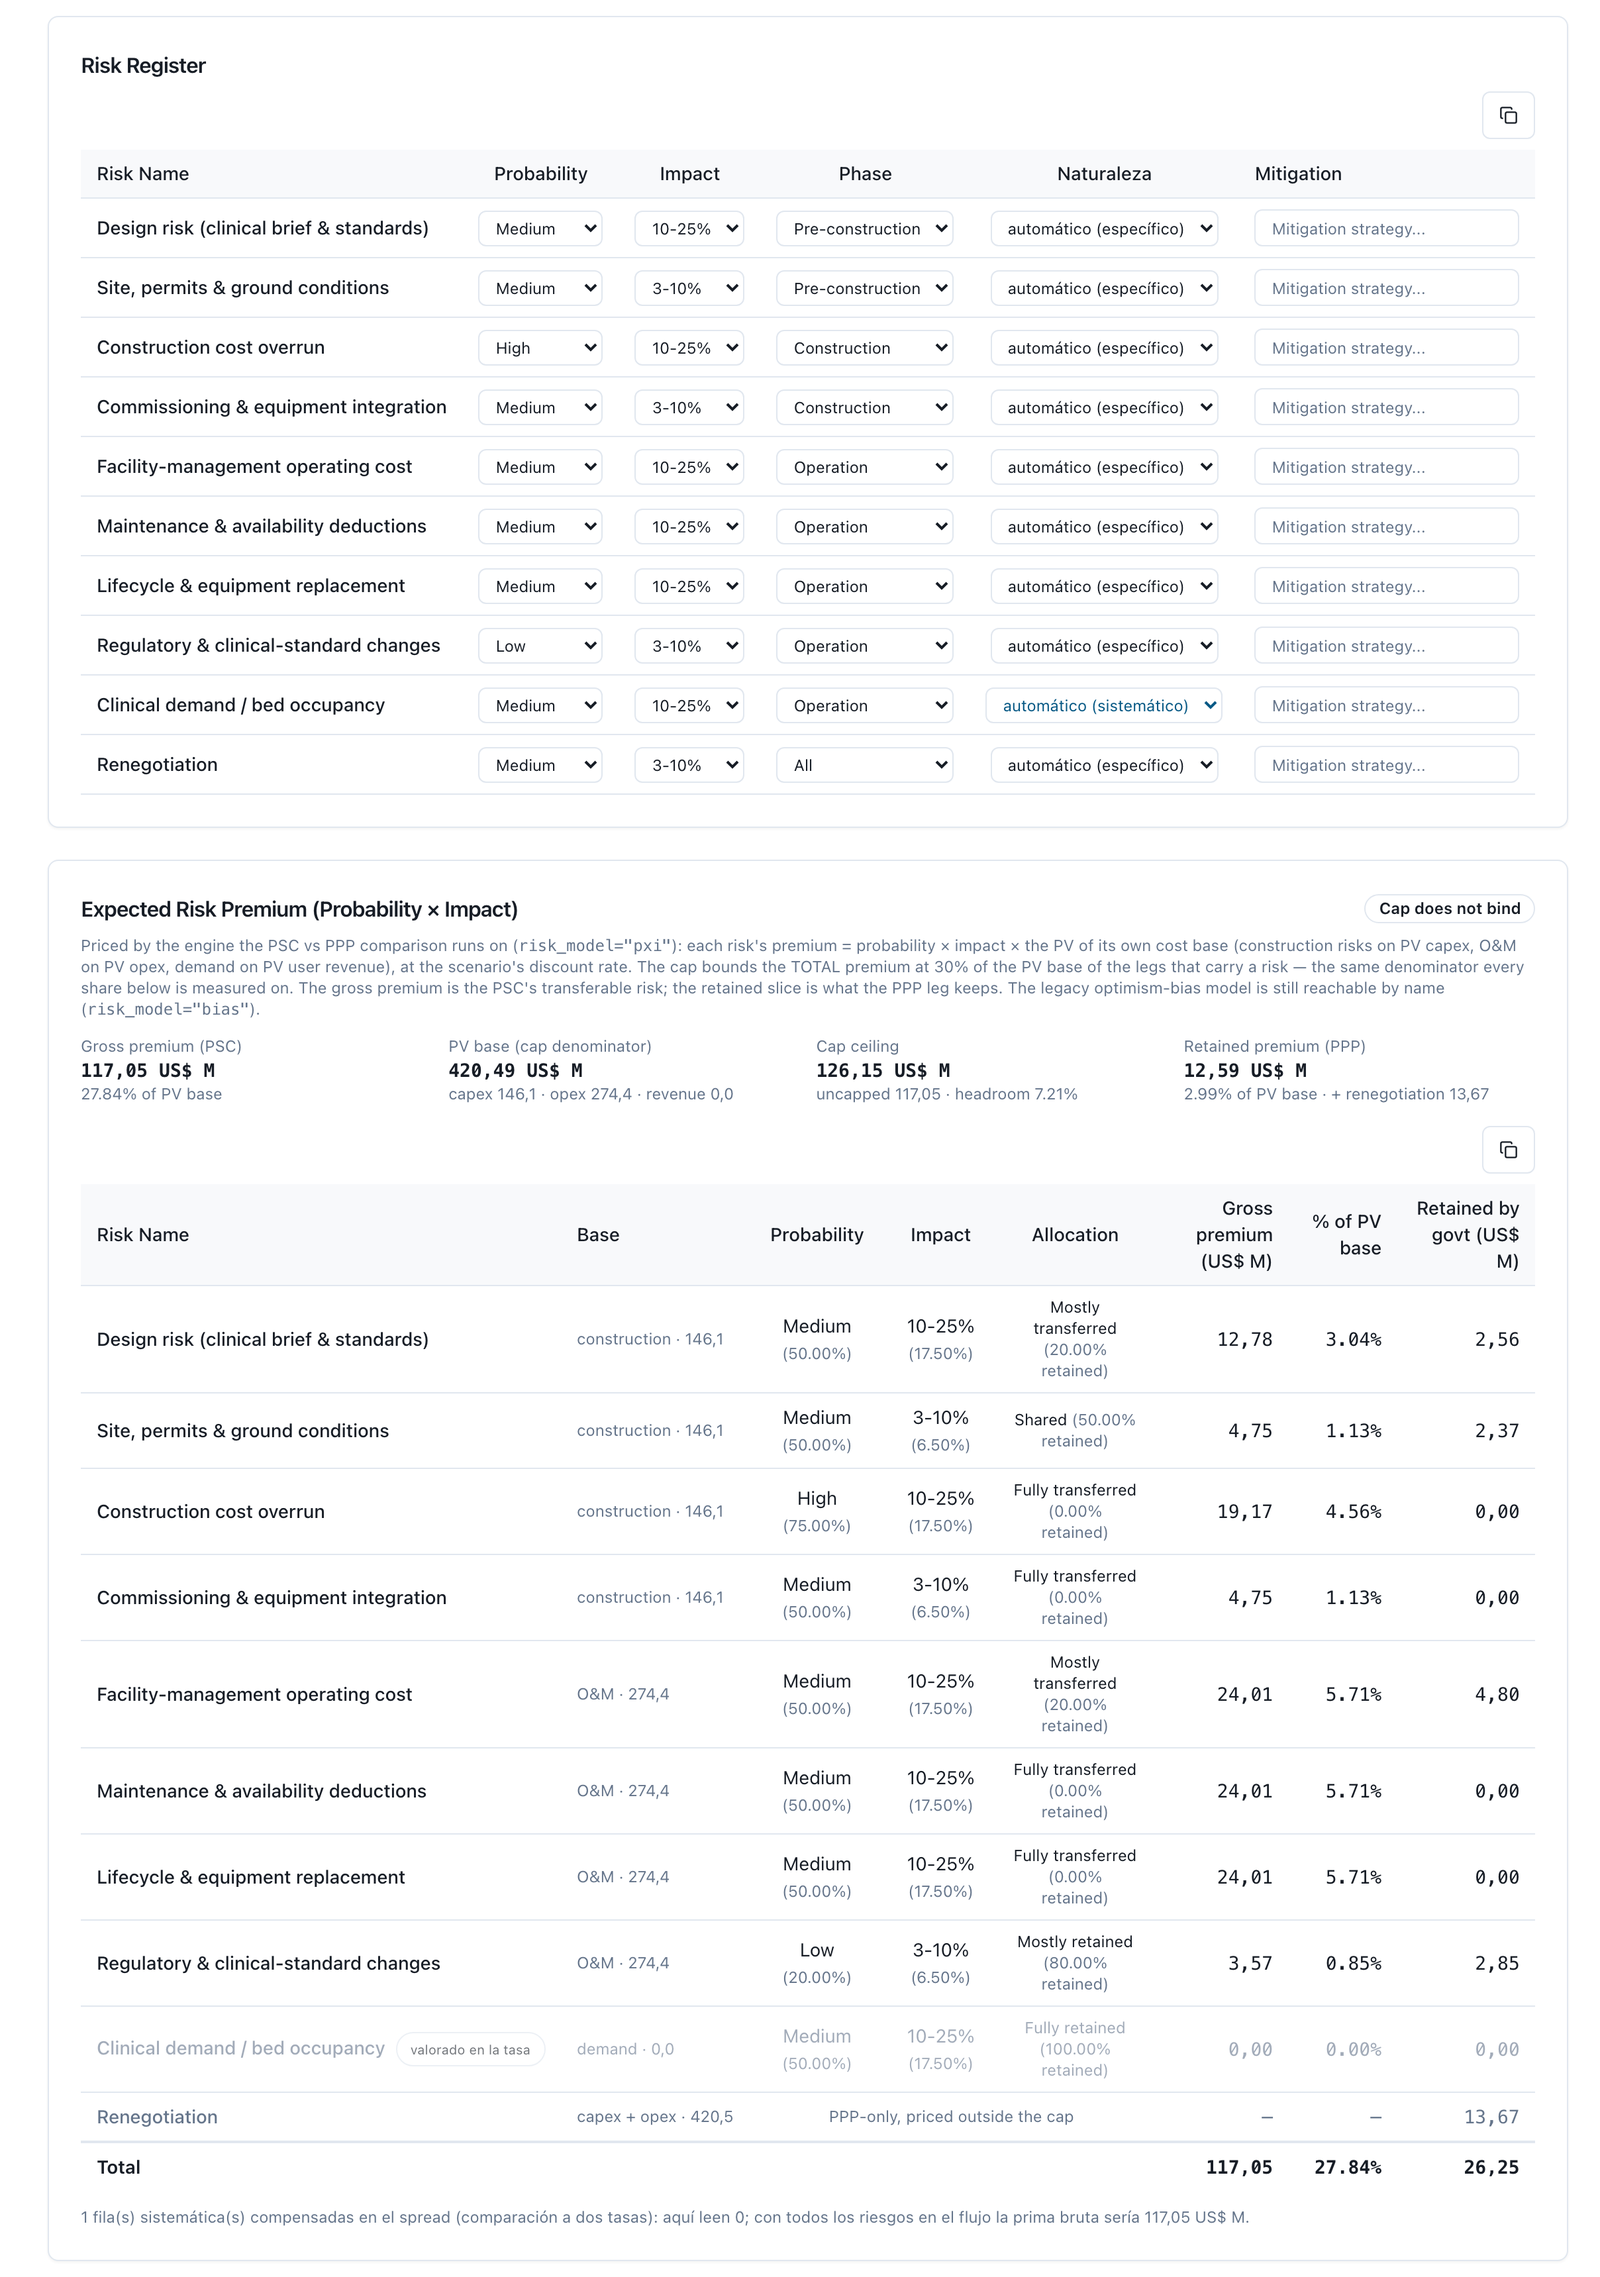
Figure 5.16 — Comparator's risk allocation with the hospital's ten risks: probability, impact, phase, nature, five‑degree allocation and the premium preview 117.05 against a ceiling of 126.15. The Value for Money manual's figure 5.11 is reused (05_c11_asignacion_riesgos.png): it is the same matrix from §4.3 in the five‑degree vocabulary. (Step 5.)
Label: Registro fiscal → contrato → Matriz de riesgos ("Fiscal register → contract → Risk matrix"; …/faro/projects/<contract>/risk). Input: PFRAM's eleven categories, rated on five levels of probability and impact, alongside the contract's profile and its guarantees. Output: the score per category and the matrix saved with the contract: the place where risk with no clause is recorded next to the commitment. For the Coastal Highway: renegotiation ⟨12⟩, the rest ⟨8–9⟩ (§4.9b). Analyst's decision: carrying rows with a clause to that manual's guarantees tab (M2's Step 3) and rows with no clause — and Step 8's silences — to this matrix. Limit: there is no bridge from the Risk Platform: the matrix is rated again here; this screen's five‑level grid has its own bands (≥ 15 critical, ≥ 8 high, ≥ 4 medium) different from the 5 × 5's, and its priority uses a different vocabulary (low / medium / high) from the Risk Platform's (accept / monitor / plan): the manual publishes the Risk Platform's engine rules and notes the difference; and this matrix does not reach the FCCL report or the contract's PDF (M2 declared it qualitative; repeated here as a limit).
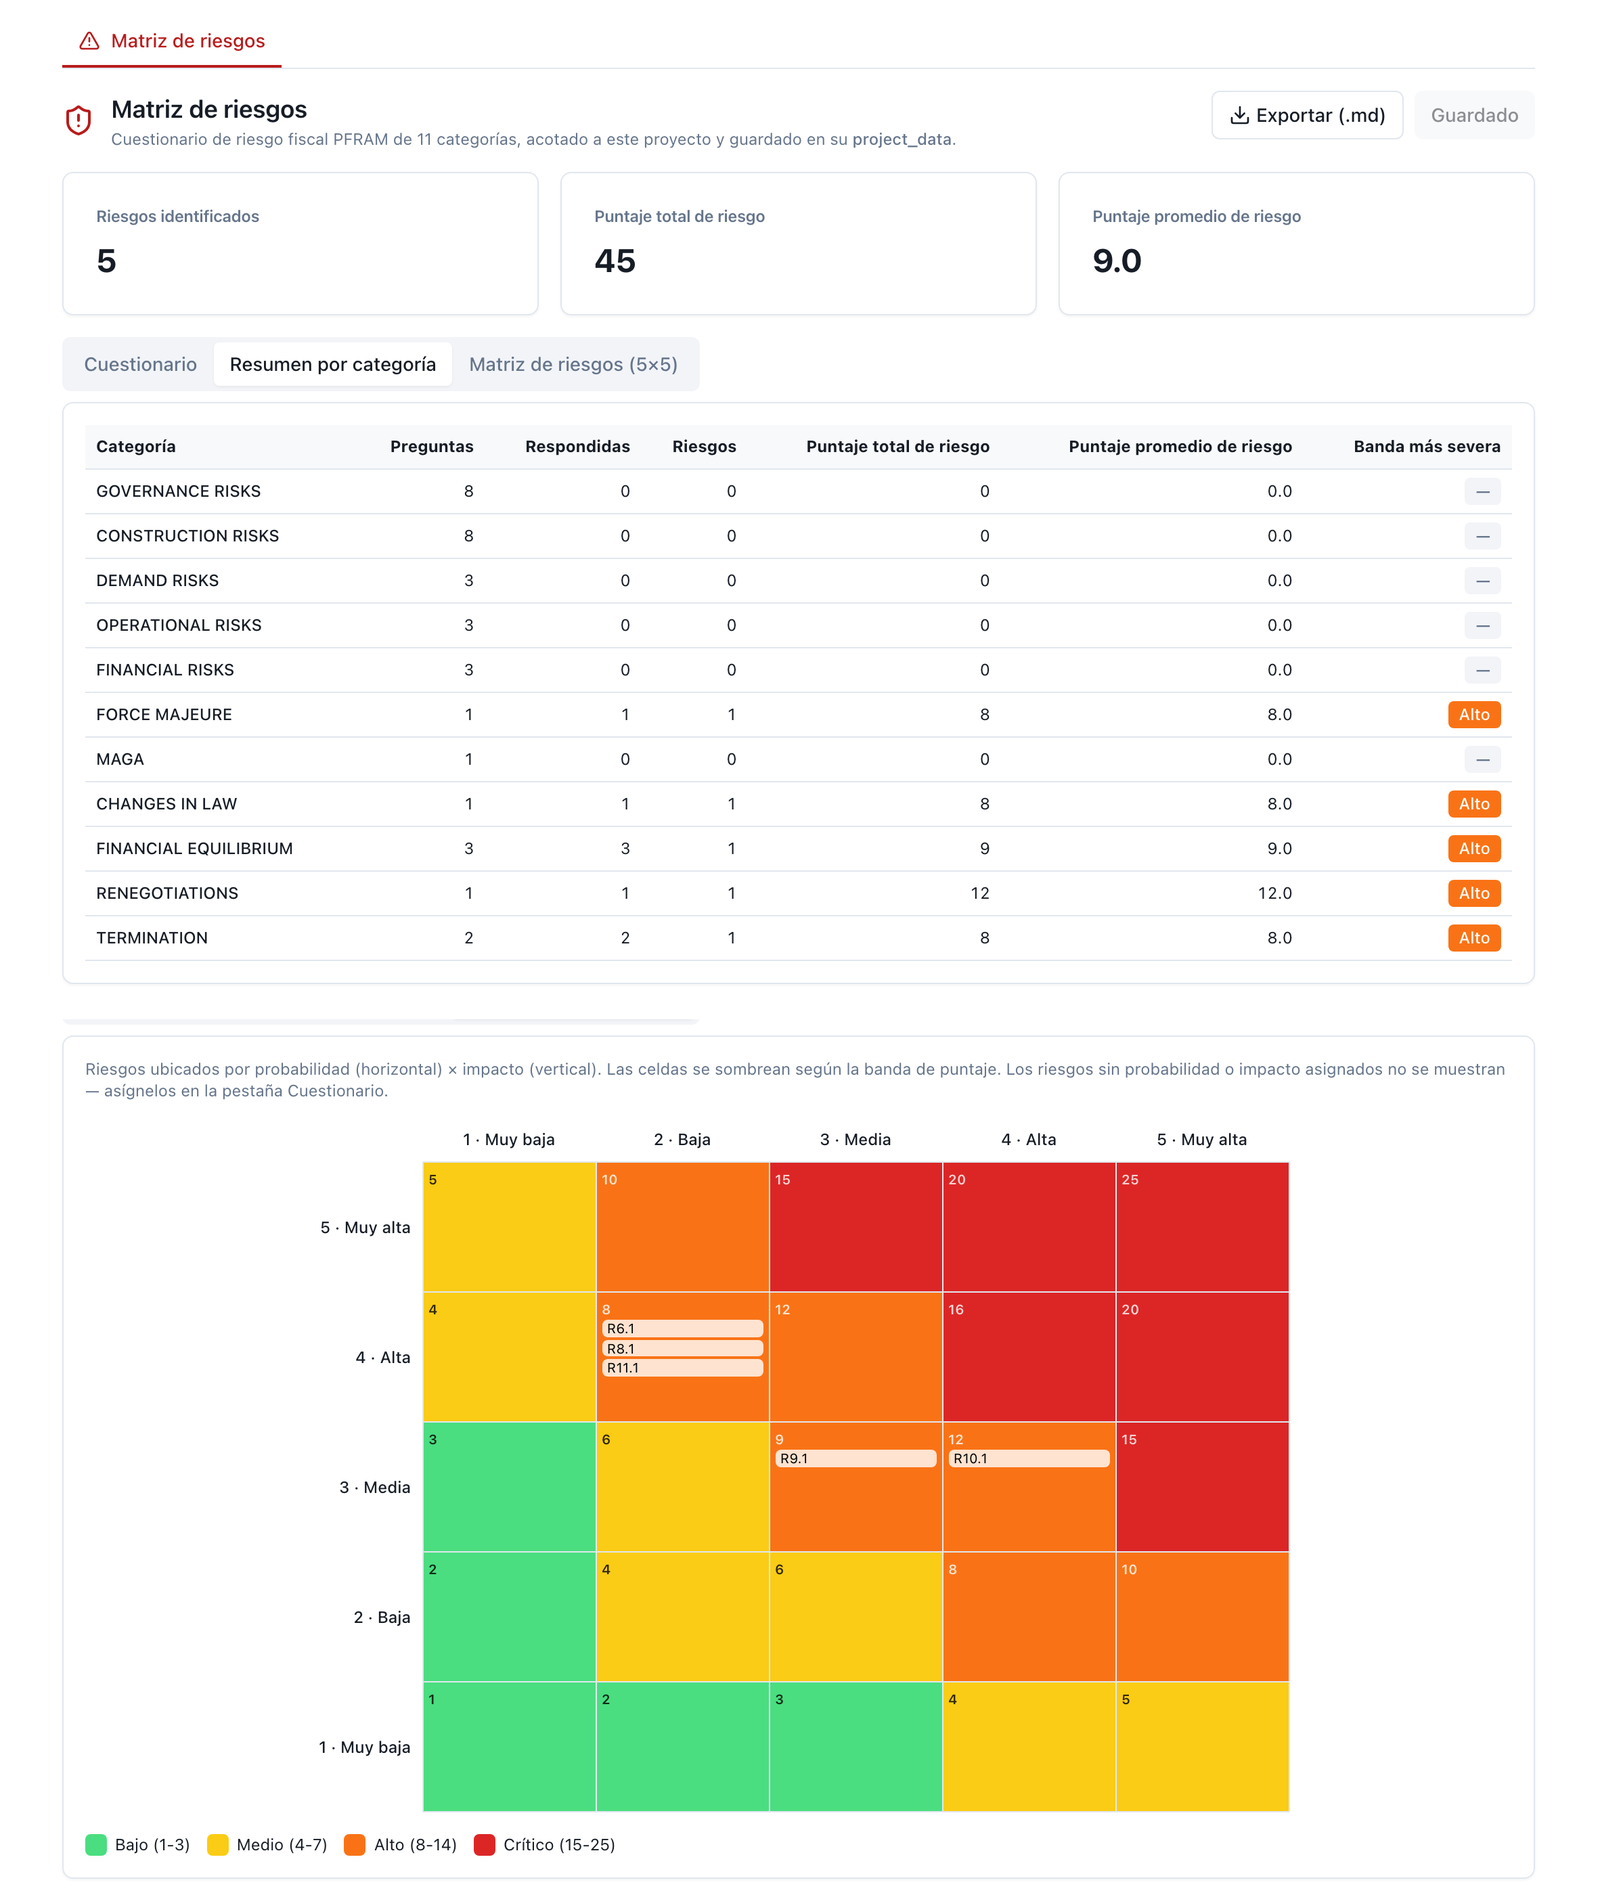
Figure 5.17 — Contract risk matrix in the fiscal register, the Coastal Highway: five categories loaded by hand (change in law, rebalancing, renegotiation, force majeure, termination), total score 45, average 9.0; renegotiation 12 as the highest, the rest at 8–9; a 5×5 map with R6.1/R8.1/R11.1 at Low × High, R9.1 at Medium × Medium and R10.1 at High × Medium. The Fiscal Commitments manual's figure 4.4 is reused (04_c04_matriz_riesgos.png). (Step 8, handoff to M2.)
What the module does well, and what this manual's index described as three registers before the September 2026 release, can now be said in one line: one catalogue, two scales, one register. The sector catalogue (Global Infrastructure Hub, eighteen sectors) and the fiscal taxonomy (PFRAM, eleven categories with their questions) come from the same engine the fiscal register uses: the categories and the questions are identical in the Risk Platform and in FARO's contract matrix, and the catalogue → PFRAM correspondence this manual's header publishes is what the cost‑of‑capital handoff and the checks use to read a catalogue row with the finance ministry's eyes. The two scales live on two screens and every response carries its framework's name: PFRAM's 3 × 3 in mitigation planning (C6) and in the quick assessment (C7); the 5 × 5 in the register (C9) and in the matrix (C10). And the scenario's register is one: the row saved from the Register screen is the one monitoring, the checks, the Excel workbook, the tail layer's preload and the handoffs read, and since the second release it also carries the catalogue category and both ratings when saved from the Register screen (C9).
What remains three, and the manual declares: the allocation matrix starts with a third vocabulary — six families, 23 risks — until a sector is loaded (C3a), and the manual teaches with the catalogue loaded; the Register screen's counters cut the score into their own bands (C9); and the contract matrix in the fiscal register rates on five levels with other bands of its own (C16). Three vocabularies on one platform are two too many, and Step 0's rule — a declared taxonomy — is what orders them: the manual allocates with the catalogue, reads with PFRAM and publishes the correspondence.
The Risk Platform rates, it does not value: none of its screens multiplies probability by impact by a cost base. Money lives in three places, and the manual teaches the circuit as it is: Step 5's expected premium — probability × impact × PV of the phase's base, with the published scale and the 30% cap — is computed on the comparator's risk allocation screen (C15), which is where §4.6.1 prints it and splits it into retained and transferred; Step 6's tail is computed on the VaR / CVaR layer (C12), with the dollar bands typed in from the same scale; and guarantees — Step 8's rows with a payment clause — are valued in the fiscal register and in the guarantees module (Fiscal Commitments manual). The circuit is register → comparator (premium) → tail layer (VaR / CVaR) → fiscal register (contingent liability), and all three screens read the same matrix because the analyst carries it — by hand across two of the three legs (5.8). The expected premium per row inside the module, with M1's scale, is in the backlog with the index's note, and is not promised.
Step 7 has no screen, by this manual's decision: a screen showing α* and M − P to two decimal places would invite reading them as measurements, and the calibration is illustrative. What exists are five calls, four on the Risk Platform and one on the comparator, all reproducible with the bodies in annex 4.A:
The frontier, the correlated one and the bridge are paid compute (an account, not a guest); the library and the anchor can be read with no account; the fifth runs with the comparator. This section describes the calls and publishes no body: the manual is not an API reference, and annex 4.A carries the five bodies with the version and the seed.
The tail layer (C12) takes, per risk, a distribution — triangular, normal or lognormal — with its parameters and a probability of occurrence; in each of the N draws, each risk occurs with its probability and, if it occurs, contributes a value from its distribution; the contributions are summed independently and the draw's total loss enters the vector the mean, the median, the VaR (the percentile) and the CVaR (the mean of what is left above the VaR) at 90, 95 and 99% are read from. N ranges from 500 to 100,000 and opens at 5,000; Step 6's rule calls for 10,000, and §4 declares this (26.38 and 52.79 with 5,000; 26.49 and 53.48 with 10,000). The seed defaults to 42 and prints in the response and next to the chart; a run with a different seed or no seed is requested only through the API, and the method's rule — a seed published with the figure — is met by the screen's. The preload from the register translates levels into a probability (0.1 / 0.3 / 0.5 / 0.7 / 0.9) and into bands in abstract units (mode 1 / 5 / 15 / 40 / 80; 0.4 and 2.5 times the mode), which the analyst replaces with Step 6's money bands — the method's default rule: the impact band's lower bound, point value and upper bound, over the PV of the phase's base and the retained fraction — and with Step 5's p. The correlated case does not enter here: it goes to the correlated frontier (5.6) and to portfolio stress testing (M9; 3.10).
What the Risk Platform delivers to other modules today — the first three from the home screen's "Send to" button (C1); the last two from the destination screen — each with what it carries and what it does not:
| Destination | What it carries | Rule | What it does not carry |
|---|---|---|---|
| Cost of capital | The fraction of each row the partner retains (0% public, 50% shared, 100% private), split by each row's fiscal category — via the catalogue → PFRAM correspondence — into systematic (governance, demand, financial, adverse government action, change in law, financial rebalancing, renegotiation, termination) and idiosyncratic (construction, operation, force majeure) | Beta tilt = 0.75 + 0.5 × systematic fraction; idiosyncratic premium = 1.5% × idiosyncratic fraction; the legacy premium, 4% × total retained fraction, as a reference only. Hospital: 0.75 and 1.39% (§4.8.3) | Degrees (20 / 80%): reads the party |
| Procurement | Bid‑evaluation criteria derived from the matrix: one scoring category per risk family present in the allocation | Equal weights across the categories present, summing to 1 (not weighted by the rating or by the number of rows) | The weight per row, the degree and the justification |
| Comparator | An indication: the fraction of rows retained versus transferred or shared (hospital: 0.30 / 0.70) and a narrative | Used to scale the PSC's retained‑risk line | The row‑by‑row register: the matrix is reloaded in C15 |
| Fiscal register | Nothing through the button: PFRAM's categories and questions are the same in both modules (5.4) | — | The contract matrix is rated again in C16; rows with a clause go by hand to the guarantees tab |
| Equator Principles | The scenario, chosen from the Equator Principles screen itself, to assess the ten principles and the A / B / C category from the profile | — | Outside the method: one line |
The Fiscal Commitments manual's rule, applied: what is missing and has no open work is declared as a limit with the manual workaround — the row‑by‑row handoff to the comparator is in the backlog; table 4.3 is loaded at both destinations, and every load carries the matrix's version (Step 9).
Everything the screens do can be called through the API from the workspace, with the account's session — catalogues, per‑scenario allocation and register, fiscal reading, the 5 × 5 grid, checks, monitoring, the tail layer with explicit N and seed, the frontier's five calls (5.6), the Excel workbook in the chosen language, loading the demonstration packs, and the interchange‑format session (exporting and importing complete scenarios, with the option to replace or add), which is the way to version the matrix (Step 9) while it has no screen; separately, a batch rating endpoint with no user session, protected by an integration key, rates lists of risks with PFRAM's rule for financial‑management systems that do not open the platform, and the manual names it without teaching it. Under the same route live extensions that are not part of the method and are cited in one line: the Equator Principles (the ten principles, the A / B / C category and the gap, assessed from the scenario: the lender's perspective); the debt sustainability analysis with country macro assumptions and the debt transparency dashboard (the portfolio: 3.10, M2 and M9); workspace analytics (counts by sector, stage and country; rows by severity; top risks; a heat map by sector); the extended cross‑sector comparison (C4 across many sectors); the AI texts (C14); and the full allocation → cost of capital → comparator → model → fiscal register flow, a "beyond the manual" case.
This section's limits in one place, each with the screen where it is described and the manual workaround when there is one; the ones fixed by the second September 2026 release (zero‑row allocation summary, a Register with a single rating and six of its own categories, a workbook with no allocation sheet, a card with no "hospital" pack) and by the third (the scenario context in Reports' AI texts, the 5 × 5 Matrix's register preload, the Register's counter bands aligned with the engine's, and the Excel workbook labelled in the session's language) no longer appear.
At the end of the walkthrough, the PPP unit has, on the platform, a scenario with its profile, its justified matrix, its fiscal reading with priority, its register rated before and after, its checks resolved or declared, its dashboard, the tail of its retained book with a seed, and the Excel workbook and the session for every version; in the comparator, the same matrix valued; in the fiscal register, the rows with a clause next to their guarantees and the contract matrix with the silences. And it takes away the tool: the workspace is the client's, with its data, its versions and its exports — "the client keeps the tool and the capacity to run it." The direct link to the guest workspace is on the manual's cover.
| Step in §3 | Risk Platform screen | Screenshot | Other module | What is done by hand |
|---|---|---|---|---|
| 0 Framework | Project configuration; allocation matrix (load sector) | C2, C3b | — | The declared taxonomy and the correspondence (header table) |
| 1 Identify | Allocation matrix (catalogue); fiscal risk (questions); register | C3b, C7, C9 | — | The "not applicable" list with reason; phase and trigger per row (notes) |
| 2 Allocate | Allocation matrix; cross‑sector comparison; allocation summary | C3b, C4, C5 | Comparator (degrees) | The sharing rule for shared rows (in the justification) |
| 3 Rate | Mitigation planning (3 × 3); fiscal risk (quick assessment); register and 5 × 5 matrix (5 × 5, before and after) | C6, C7, C9, C10 | — | What is scored in the 5 × 5 matrix is typed into the register |
| 4 Mitigate | Mitigation planning (by category); register (by row: action, owner, deadline, status) | C6, C9 | — | The verifier and the owner as an entity (in the mitigation text) |
| 5 Premium | — | — | Comparator's risk allocation | Reload the matrix with its degrees |
| 6 Tail | VaR / CVaR layer | C12 | — | Type in the money bands and Step 5's p |
| 7 Test | — (frontier and diagnostic through the API) | — | Comparator's allocation diagnostic | Force the frontier class; read as an order |
| 8 Clauses | — | — | Contract risk matrix and guarantees tab in the fiscal register | The clause list and the silences list; rate again in FARO |
| 9 Verify, register, monitor | Checks; fiscal summary; monitoring; reports and Excel workbook; home screen and "Send to" | C11, C8, C13, C14, C1 | Cost of capital; procurement; comparator (indication) | The version (one scenario per milestone; session through the API) |
| 3.10 Portfolio | — (debt sustainability and transparency under the same route: one line) | — | M2; M9 | — |
The method in §3 can be run on a spreadsheet, and almost every risk matrix that exists today was made on one: the adviser's, the approval's, the tender documents' annex, the bidder's model. This section does not repeat the general argument against spreadsheets — speed, size, fragile formulas — which holds for any computation. It covers the seven points where risk allocation and analysis fail on a spreadsheet in a way no one sees, because the matrix still has colours, "shared" is still a word in a cell, and the contract still gets signed.
Every failure is presented the same way: which §3 step it occurs at; what fails on the spreadsheet; §4's example figure — the 300‑bed hospital, with the comparator's premium at two rates, the tail with N 10,000 and seed 42, the frontier with the paper's illustrative calibration, or Itata's banded rule — showing the size of the error; and what the tool does instead, with §5's screen. The annex at the end lists every figure with its origin. And, as in the earlier manuals, it says plainly when the failure still happens to the tool itself: the Risk Platform rates and does not value, stores an owner that is a party and not an entity, preloads the tail in units that are not money, and does not compare the register with the fiscal reading; §4 shows this instead of smoothing it over.
Where it occurs. Step 0, when the taxonomy is declared; Step 9, when the comptroller general compares the approval's matrix with the tender documents'.
What fails on the spreadsheet. The approval's matrix was made on a sheet with the adviser's taxonomy; the tender documents' was written with the Concessions Directorate's; the financial model's, with six families the modeller had on hand. Three spreadsheets, three vocabularies, and no one can say whether "land risk" in the first, "expropriations" in the second and "site" in the third are the same row, or whether the demand the model calls "revenue" is what the approval called "occupancy." Over the hospital, the same register exists in three legitimate vocabularies — sixteen sector‑catalogue categories, eleven PFRAM ones, ten comparator rows — and the translation between them is not obvious: six catalogue categories fall into a single PFRAM one (construction), "strategic / counterparty" falls into adverse government action, and renegotiation does not exist in the sector catalogue. With a declared correspondence, the sixteen reduce to ten rows and six "not applicable" with reason; without it, every document has its own count and the comptroller general can verify nothing. And a consequence §4.4 showed: clinical demand is "low relevance" on the fiscal reading and "high" on the register, and both are correct because they answer two different questions; across three spreadsheets that difference is a contradiction someone "corrects" by making the two match, and the row the ministry pays for disappears.
What the tool does. A catalogue by sector (18 sectors, 16 categories and 47 sub‑risks for a hospital) and an eleven‑category fiscal taxonomy shared by the Risk Platform and the fiscal register, with the correspondence between the two declared — this manual's header table, which is also what the cost‑of‑capital handoff uses; register rows carry their catalogue category and the checks flag the ones that do not (screenshots 3, 9, 11). What the tool does not yet do: it does not compare the register with the fiscal reading — demand "high" and "low relevance" pass with no flag — and the allocation matrix starts with a third vocabulary of six families until a sector is loaded; the manual teaches with the catalogue loaded and declares this (§5).
Where it occurs. Step 2, when the allocation is written; Step 8, when the clause is sought.
What fails on the spreadsheet. The cell says "shared" and the contract does not say how. No percentage, no deductible, no band, no cap; there is a word and a colour, and the sharing rule gets argued over when the event occurs, with the Technical Panel as arbiter of what the matrix did not write. Over Itata's box: the same row — additional environmental measures from the qualification ruling — under the word "shared 50%" with no deductible costs the MOP UF 345,000 at the P95 and also spreads the low tail the concessionaire manages; under the 2023 tender documents' three‑band rule — a UF 236,000 deductible, a UF 100,000 shared band, the excess to the MOP — it costs UF 405,000 at the P95 and zero at the median, with the concessionaire capped at UF 286,000; and under "entirely at risk" it costs zero and comes back as a guarantee, because the concessionaire's P95, UF 691,000, is the figure no lender leaves uncovered. Three rules, three contracts, one word. And over the hospital: "land, permits and soil" is shared at 50% in the comparator and "Shared" in the scenario, and neither has a rule; the row is worth 4.75 in premium and 2.37 retained, and that 50% is a scale convention until a geotechnical baseline exists saying from what depth the State pays.
What the tool does. The workspace's allocation matrix stores per row the public / private / shared percentages — which must sum to 100 — with the justification (screenshot 3); the scenario stores the party under the majority rule with ties going to shared, and §4.3 shows the two match row for row for the hospital. What the tool does not do: it has no field for the sharing rule — deductible, bands, cap — and valuing that rule in the tail is the method's job (box 4.9c), not the screen's; the rule lives in the justification and in the clause.
Where it occurs. Step 3, when rating is done; Step 5, when the rating turns into money.
What fails on the spreadsheet. "High" is worth 0.5 on one sheet, 0.7 on another and 0.75 on a third; "medium" is 3 on a five‑level grid and 2 on a three‑level one; and the conversion from label to figure is in the head of whoever scored it, not on the sheet. The Value for Money manual showed a register with bands and no probability that rated all ten risks the same; this manual shows the next failure: two correct grids that contradict each other if they are not named. High × high is "high" (16 of 25) on the five‑level grid and "critical" on the three‑level one, and the hospital's works cost overrun is both at once; a report that puts "critical" on the finance ministry's page and "high" on the register with no note on which grid each is from is contradicting itself without knowing it, and one that "harmonises" them by hand loses the fiscal reading. And the probability scale: the tail layer's preload translates "high" to 0.7 and the comparator values it at 0.75; "low" to 0.3 and 0.20. Over the hospital's regulatory change (low probability), the difference between 0.3 and 0.2 is 50% of the row's premium — 2.85 retained with the comparator's scale, 4.28 with the preload's; over the cost overrun (high), 0.7 versus 0.75 is worth 1.28 in gross premium. Two scales on the same platform, and the manual publishes which one it uses.
What the tool does. Two named grids, each with its framework in the response — PFRAM's 3 × 3 in mitigation planning and the quick assessment, with figure 7's rule cell for cell; the five‑level grid in the register and the matrix, with the 1–4 / 5–9 / 10–16 / 20–25 bands published as an Austral convention — and the warning that the same cell falls into different bands on the two (screenshots 6, 7, 10); the comparator's probability‑and‑impact scale published in the risk allocation screen (screenshot 15). What the tool does not do: unify the tail preload's probability scale with the comparator's, and the priority's "unmitigated medium" cell, which PFRAM calls "high priority" and the screen calls "monitor"; both are declared in §5.
Where it occurs. Step 2, when allocated; Step 7, when tested.
What fails on the spreadsheet. The spreadsheet credits the transfer: a demand row "transferred to the private party" lowers retained risk, raises value for money, and no one asks whether the partner can manage it or at what price it will accept it. The retention frontier answers both questions and the spreadsheet answers neither. Over the hospital: with clinical demand retained at 100%, the transfer is worth zero — neither creates nor destroys; transferred at 80%, M − P = −0.160; at 90%, −0.427; at 100%, −0.750 and infeasible transfer, because demand's bankability ceiling is 90% and no lender takes on a public hospital's occupancy with no guarantee. A comparator that credited that transfer at full premium would book value created — a medium × 10–25% demand row is worth, on a revenue base the size of the operation row, the same 24.01 the operation row is worth with the same probability and impact — where the frontier shows value destroyed, and since all of the hospital's value for money (+32.0) is in the 104.46 of transferred works and life‑cycle risk, the sign flips before the payment formula exists. And the row comes back with a name: on the Coastal Highway, "transferred" demand came back as a minimum revenue guarantee with an expected value of 68.0 over the contract's life (226.9 with the toll floor), which is the State retaining the low tail at a price; the Fiscal Commitments manual valued it and this one shows which row it came from. Over the paper's example: the doctrinal allocation of transferring almost everything pays 6.24 units of extra cost‑of‑capital cost for three macro transfers that destroy value, two of them infeasible.
What the tool does. The comparator's allocation diagnostic and the Risk Platform's frontier, through the API: per row, the class, α*, the ceiling, the verdict and M − P, and over the matrix the observed implicit cost of capital against the efficient one (annex 4.A, no screen by design). What the tool does not do, and the manual says so: the keyword mapper reads "permits" as a political risk and "building" as construction with the demonstration scenario's names — two of ten rows — and the class is forced per row; renegotiation has no frontier class; and the calibration is illustrative, so what is read is the order and the sign of M − P, never the figure.
Where it occurs. Step 6, when the retained book's tail is valued.
What fails on the spreadsheet. Each risk has its own "maximum" column, and the book's maximum is the sum of the maximums — or is nothing, because no one summed it. Over the hospital's retained book — five rows in dollars, with the comparator scale's bands: the sum of the maximums is 92.3; the simulated maximum over 10,000 draws is 78.5, the P99 is 63.0 and the P95 is 53.5. The sum of maximums overstates the P99 by 47%. The other spreadsheet, the one that sums each risk's VaR95 computed alone, gives 76.3 — 43% above the book's VaR95 — because it sums tails that do not occur together; and the third, which simulates nothing and sums probability times mode, gives 26.25, which is the mean and not the tail. None of the three is the figure the finance ministry compares with its reserve: the only one is the simulated book's, 53.5 at the P95 and 59.4 in expected shortfall in the tail, with the warning that it sums independently and that, if the rows moved together, the P95 would be higher, not lower. And the failure has a second floor: with no seed, two runs give two tails; with N and the seed declared, the figure is reproducible (26.49 / 53.48 with seed 42; 26.34 / 53.69 with the next one; 26.38 / 52.79 with N 5,000), and the difference between runs is the sampling error, which the sheet does not report.
What the tool does. The tail layer: per row, distribution, parameters and probability of occurrence; N and seed, with the seed used printed in the response; mean, median, standard deviation, maximum, VaR and CVaR at 90 / 95 / 99%, a histogram and per‑row contribution (screenshot 12). What the tool does not do: it does not correlate — it sums independently, and the manual refers the correlated case to portfolio stress testing and to the frontier's correlated variant — and it preloads from the register in abstract units (mean 189.3, VaR95 314.5 over the hospital, in units that are not money), so the dollar bands are the method's until the expected premium per row exists inside the module.
Where it occurs. Step 4, when mitigation is planned; Step 9, when it is monitored.
What fails on the spreadsheet. The "mitigation" column has a verb — "manage," "insure," "monitor" — and no name, date or verifier; and the residual rating drops on its own, because the same person who wrote the verb put "medium" where there had been "high." Over the hospital: seven of the ten rows drop a band after mitigation — the cost overrun from 16 to 9, the three operation rows from 12 to 6 or 9 — and the one that does not drop, clinical demand, is the one the spreadsheet would have dropped anyway, with a verb, because nothing on a sheet stops someone from writing "medium" in the "after" cell. The register leaves it at 12 — high — because no mitigation reduces actual occupancy; the dashboard raises it as the only alert; and the method sends it to the fiscal register as a row with a clause. A spreadsheet has no dashboard, no alert and no destination.
What the tool does. The register with owner, mitigation, status and residual rating per row; monitoring by status, severity and category with high‑residual alerts (screenshots 9, 13); and the check that flags rows with no mitigation, no owner, and high rows with no residual rating (screenshot 11). What the tool does not do, and this is the failure in this section that happens to it too: the demonstration scenario stores the party as the owner — "Public" or "Private" — and not an entity, so the "mitigation with no owner" check passes with no real owner; there is no verifier field or mitigation‑date field, and the column is the method's. The manual writes the owner and the verifier in §4.5's table and declares this.
Where it occurs. Step 9, when the matrix changes; and for the contract's whole life.
What fails on the spreadsheet. The renegotiated matrix overwrites the original. The supplementary agreement that moved a row — the change in technical standard that went from "design risk" to "compensable," the environmental deductible that rose — is saved over the approval's matrix, and when the Technical Panel or the comptroller general asks for the matrix, they get the latest one, with no way to know it is the latest. Over the hospital: this example's matrix produces a retained book of 26.25 and a value for money of +5.8%; the same matrix with demand at 80% retained produces a different book, a different frontier verdict (negative M − P) and a different comparator sign, and both are "the hospital's matrix" if no one dates them. Over the Coastal Highway: the Fiscal Commitments manual valued the guarantee at 68.0 and the Payment Mechanisms manual showed the same clause is worth 226.9 or zero depending on the convention; with no version, the three figures are the same guarantee and none of them can be defended.
What the tool does. Named, dated scenarios with their inputs; the exportable interchange‑format session and the five‑sheet workbook with the scenario's matrix, allocation, register, fiscal reading and monitoring (screenshot 14); and the consistency checks per scenario or for the whole workspace, which confirm that the matrix that was saved is the one that was approved. What the tool does not do: it does not export the matrix in the tender‑document annex's format — Step 8's clause list is written by hand — and it does not version a renegotiation as a new matrix alongside the previous one; today it is a new scenario, and the manual declares this.
| Failure | Step | §4's figure | What the tool does |
|---|---|---|---|
| The matrix that is not the same matrix | 0, 9 | 16 catalogue categories → 11 PFRAM ones → 10 rows and 6 "not applicable"; demand "high" and "low relevance" at once | A catalogue by sector and a shared fiscal taxonomy, with a declared correspondence (screenshots 3, 9, 11); does not compare the register with the fiscal reading |
| Shared with no rule | 2, 8 | Itata: MOP UF 405,000 at the P95 with bands, UF 345,000 with "50%," zero with "entirely at risk"; the hospital's land at 50% with no rule | Percentages with justification; the sharing rule lives in the clause (screenshot 3) |
| The scale in the analyst's head | 3, 5 | High × high = 16 "high" and "critical"; 0.7 versus 0.75; 0.3 versus 0.2 (2.85 → 4.28 on one row) | Two named grids with their framework; the comparator's scale published (screenshots 6, 7, 10, 15) |
| The risk that was transferred and came back | 2, 7 | Demand: M − P from 0 to −0.750, infeasible at 100%; the minimum revenue guarantee at 68.0 as demand come back | Frontier diagnostic through the API, order and sign (annex 4.A) |
| The tail no one summed | 6 | Sum of maximums 92.3 against P99 63.0; sum of VaR95 76.3 against VaR95 53.5; mean 26.25 | Tail layer with N and seed printed (screenshot 12); independent, preloads in abstract units |
| Mitigation with no owner | 4, 9 | Seven rows drop a band, demand stays at 12 and is the alert | Owner, status, residual, alerts and checks (screenshots 9, 11, 13); the demo's owner is a party |
| No version | 9 | 26.25 / +5.8% against a different book and a different sign with demand at 80%; 68.0 / 226.9 / 0 | Scenarios, exportable session, five‑sheet workbook, checks (screenshot 14); no tender‑document annex or renegotiation version |
It would be dishonest to close without saying what the spreadsheet does better. It is the best tool for talking through a matrix in a workshop: projecting sixteen rows, discussing with the sector who controls patient referrals and who controls the permits, moving a cell from "shared" to "retained" and watching the lender's face; the sector catalogue fits on one sheet and the workshop needs it on one sheet. It is the best tool for reading a clause: Itata's three bands and the 2013 deductible are understood in four rows with a UF column, and that sheet is the place to compare two sets of tender documents. And it is the format most ministries receive the adviser's matrix in and the one the platform hands it back in: the five‑sheet workbook exists for that.
What changes is where the matrix gets fixed, tested, valued and defended: in a register with a declared taxonomy and a correspondence; with the sharing rule written next to the party; with two named scales; with a frontier that says which transfer creates value and which comes back; with a tail simulated with a seed; with an owner and an alert; and with a version. The tool did not learn any of that by design; it learned it by being corrected — the owner that is a party, the moneyless preload, the double probability scale are all still on the list — and it corrects it once for every contract. That is the difference from the spreadsheet. Not that it never fails; that when it fails, it leaves a trace, and the trace is what let this manual say the hospital's matrix retains 26 in expectation, 53 at the P95, and that neither figure was in the comparator.
Every figure is a run of annex 4.A's script over the platform's engines: the Risk Platform's sector catalogue and fiscal taxonomy; the "hospital" scenario from the demonstration pack; both grids' rating rules exactly as the engine returns them; the comparator over the hospital pack at two rates (2.70% + 0 / 0.90%) and at one (5.5%), the probability × impact model with the 30% cap; the tail layer with N 10,000 and seed 42 over the comparator scale's declared bands; the frontier diagnostic with the paper's illustrative calibration; Itata's banded rule applied draw by draw. Nothing is written by hand except Step 6's dollar bands and the banded formula, declared as such.
| Figure | Origin |
|---|---|
| 18 sectors; 16 categories and 47 sub‑risks in the hospital; 10 rows and 6 "not applicable" | Sector catalogue and demonstration scenario (§4.1–4.2) |
| Demand "low relevance" (fiscal) and 12 "high" (register) | PFRAM rule and the five‑level grid over the scenario (§4.4) |
| Itata: MOP UF 405,000 (P95) and 0 (median); "50%": UF 345,000; "entirely at risk": concessionaire UF 691,000; 2013: MOP UF 661,000 | The layer's sampler, triangular UF 60,000 / 250,000 / 900,000, p 0.6, N 10,000, seed 42, with each contract's rule applied draw by draw (§4.9c) |
| Land 4.75 in premium, 2.37 retained at 50% | Decomposition of the comparator's premium at two rates (§4.6.1) |
| High × high = 16 "high" / "critical" | The five‑level grid and the PFRAM rule over the same cell (§4.4) |
| 2.85 → 4.28; 1.28 on the cost overrun | Row premium (p × i × base) with 0.2 and 0.3, and with 0.75 and 0.7; bases at two rates (§4.6.1 and §4.6.2) |
| Demand's M − P: 0 / +0.312 / −0.160 / −0.427 / −0.750; infeasible at 0% retained | Frontier, demand class (p 3.50, m 1.00, r 0.60, τ_max 0.90) with retention 100 / 50 / 20 / 10 / 0% (§4.7) |
| 24.01 as the premium of a medium × 10–25% row on a base of 274.4 | The operation row with that p and i on its base; the hospital's demand row has a zero base (§4.6.1) |
| 104.46 transferred, 13.67 renegotiation, +32.0 (+5.8%) | Comparator at two rates (§4.6.1) |
| 68.0 / 226.9 / 0 for the Coastal Highway's guarantee; 6.24 from the paper's example | Cited from the Fiscal Commitments and Payment Mechanisms manuals; frontier over the seven‑risk vector (§4.7, §4.9b) |
| Sum of maximums 92.3; maximum 78.5; P99 63.0; P95 53.5; CVaR95 59.4; sum of VaR95 76.3; mean 26.49 / 26.25 | Tail layer over the five‑row retained book; each row alone for the sum of VaR95 (§4.6.2) |
| 26.34 / 53.69 (seed 43); 26.38 / 52.79 (N 5,000); preload 189.3 / 314.5 | Checks on the same layer; register preload in abstract units (§4.6.2) |
| Seven rows drop a band; demand 12 → 12; one alert | Five‑level grid before and after; monitoring over the register (§4.4, §4.8.3) |
| Three check errors; owner "Public / Private" | Consistency checks over the scenario; the register's owner field (§4.5, §4.8.2) |
All references were consulted on 17 September 2026. Unless stated otherwise, each document was read in its official version (PDF downloaded from the publisher's site or from its archived copy when the site blocks automated downloads, the legal text from the official compilation, a local copy of the same PDF, or OCR text from the concesiones corpus for the Chilean contracts and the Technical Panel's rulings; which one is stated). ✔ = verified by direct reading for this manual; ✔M1 / ✔M2 / ✔M3 / ✔M4 = verified for that manual and not reread; ✔A = verified in an Austral paper with a recorded verification; PV = to be verified (existence confirmed; the figure cited is checked against the document before it is quoted in the body). Where a document was read through another reference, this is stated.